
The April Window: The Most Important Pivot of the Year
For several months now I’ve been repeating the same message: the April–May window may be the most important period of the year for this market.
In fact, for our Founding Members this time factor isn’t new at all. We first began discussing its potential significance nearly a year ago, and it became a central part of the roadmap we laid out in December’s annual outlook.
Now that we are moving deeper into March, the market is rapidly approaching that window — and with each passing day the evidence continues to build that something significant is developing beneath the surface.
When multiple time factors begin to cluster together like this, history shows that the result is rarely subtle. These types of alignments tend to precede major pivots in the market, the kind that only become obvious after the move has already taken place.
That’s exactly what I want to focus on today.
As we move into the second half of March, I want to walk through the mounting evidence behind this window. We’ll start with the seasonal timing currently unfolding, then move into early April where a number of powerful time relationships begin to converge.
Taken together, these signals suggest that the market may be approaching a moment that could ultimately be remembered as a major turning point in this cycle.
With several tight windows compressing over the next three months, volatility is almost certain to explode. And unless you know the specific dates and structures to watch, navigating this period could become an emotional and confusing experience for many investors.
Fortunately, the market tends to leave clues long before these events unfold.
And right now, those clues are pointing directly at the weeks ahead.
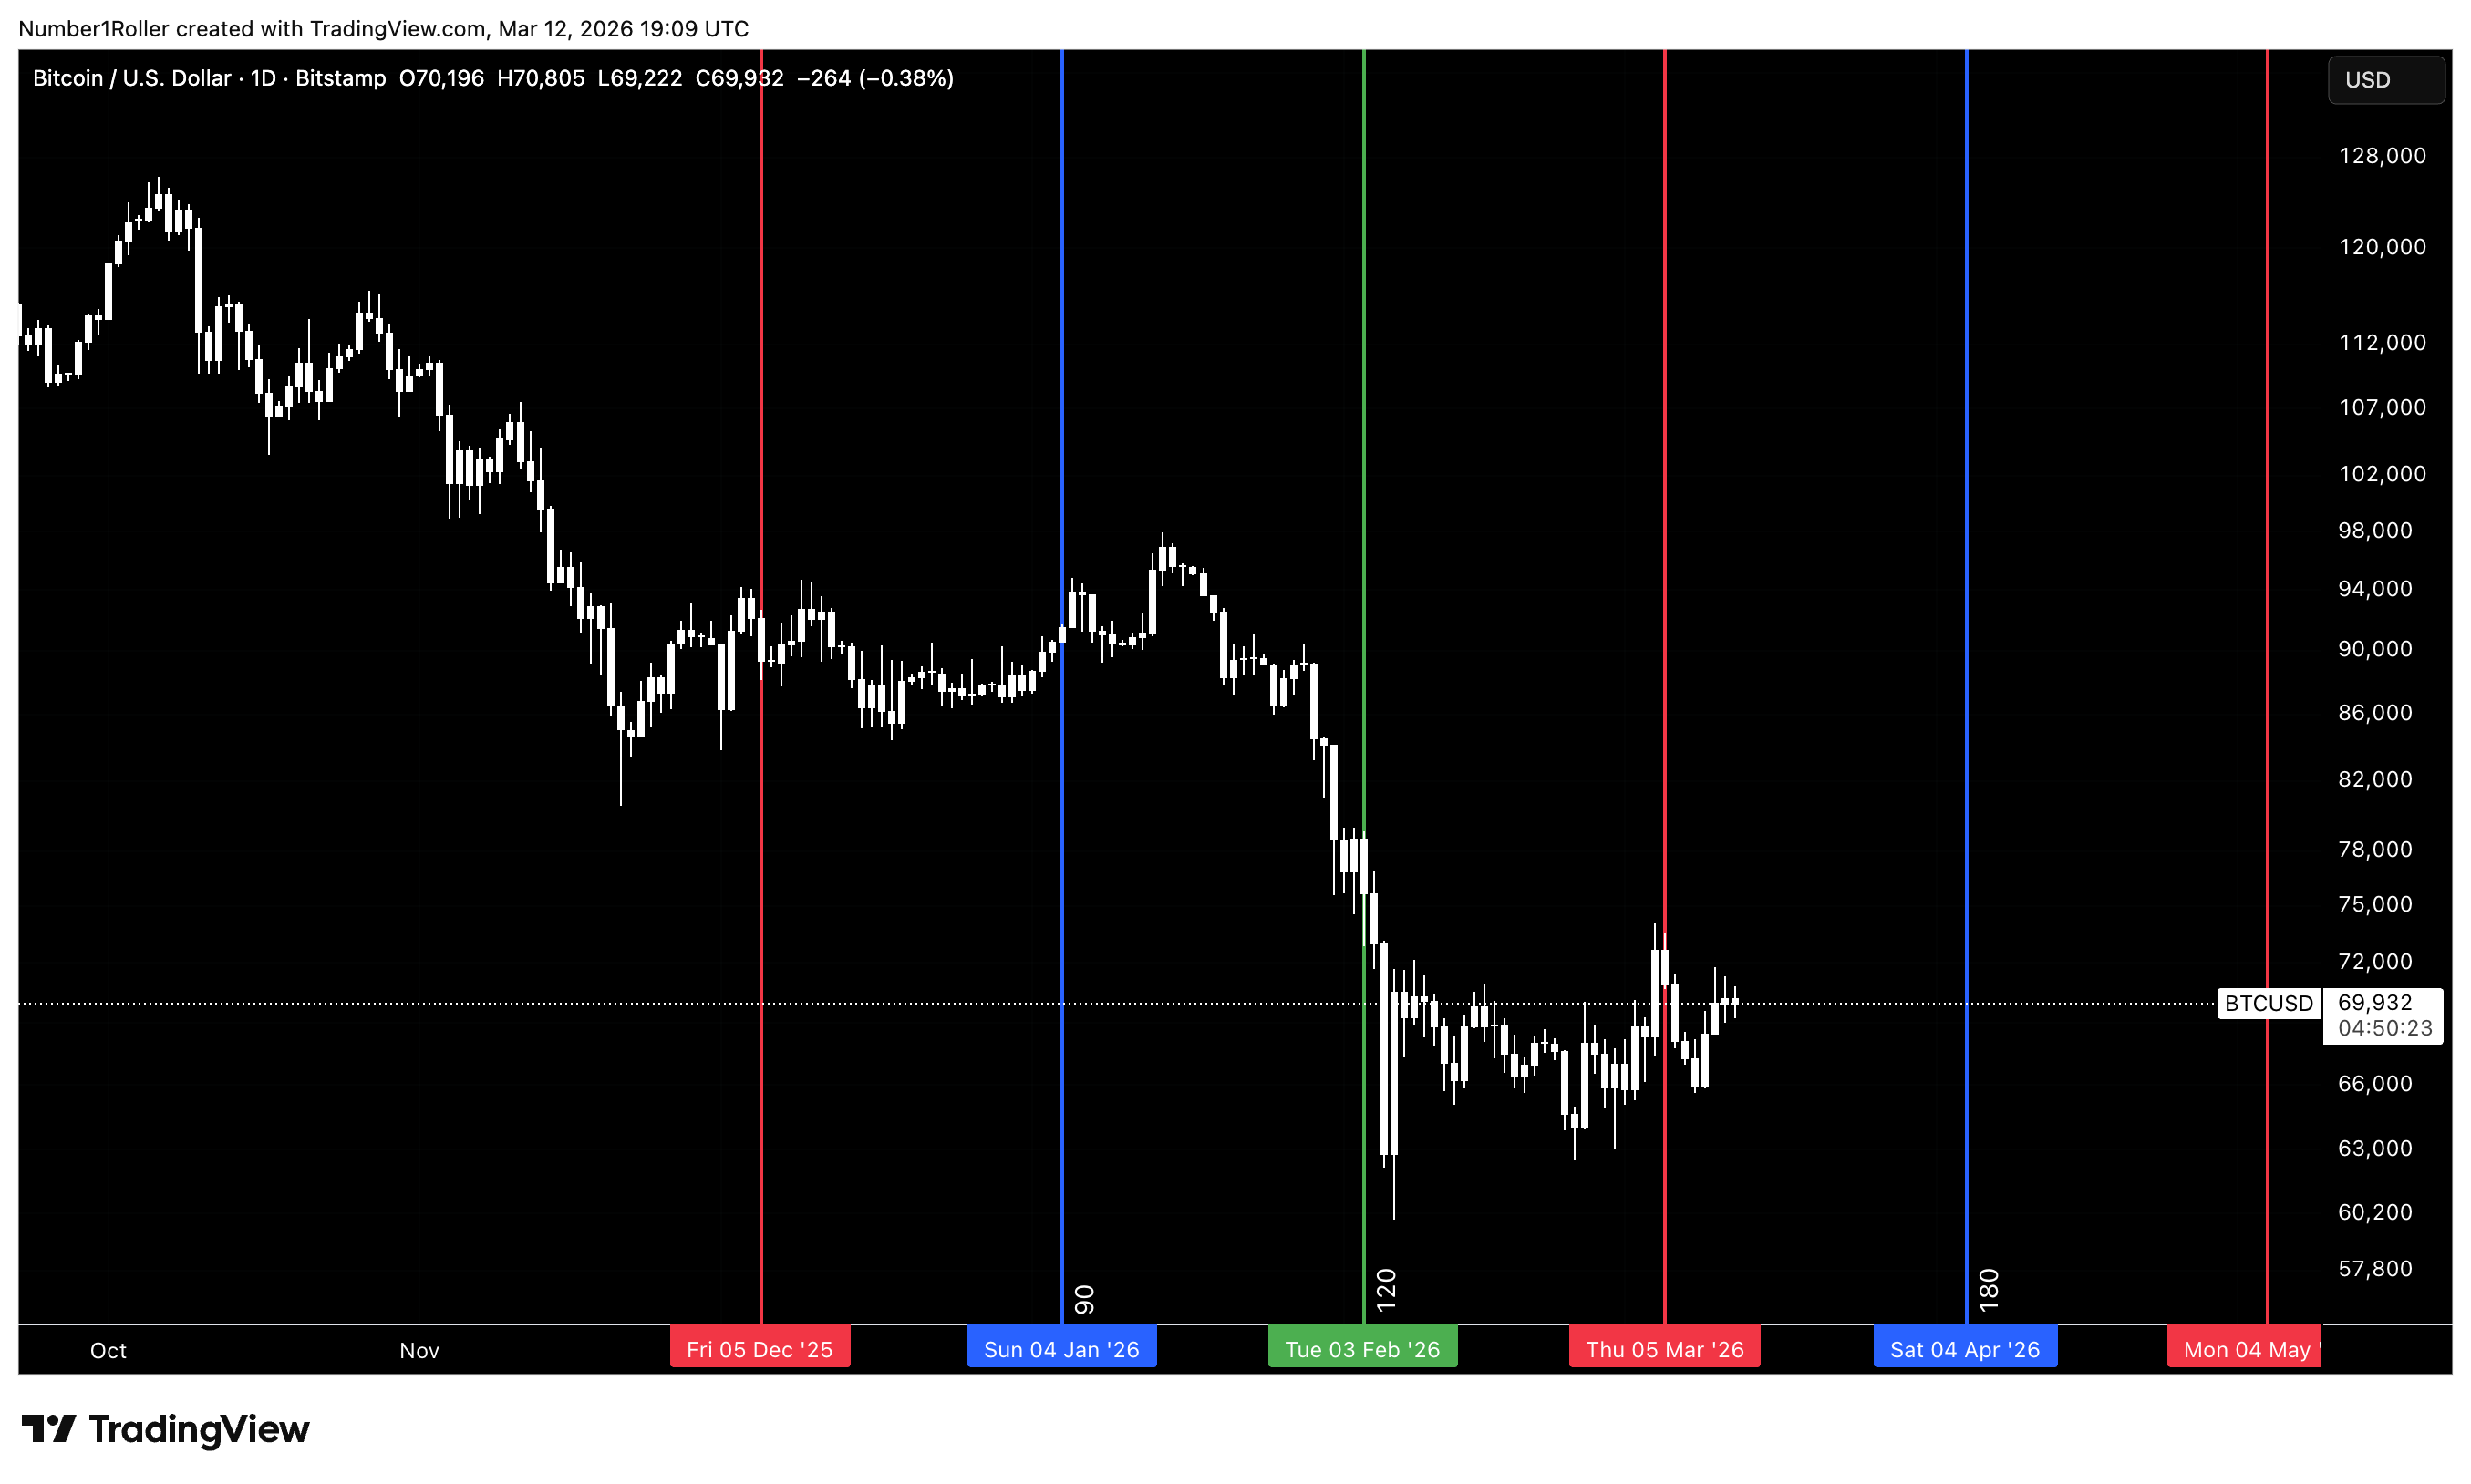
The Late March Pressure Window
As you know, we initially forecasted the week of March 16th in our annual outlook as one of the key weeks of the year.
Now that we’ve arrived in this window, it’s worth zooming in to examine why this period may be so important — and what it could mean as we move into April and May.
I covered many of the reasons for this window in the March 1 outlook, so rather than repeating everything, I want to focus today on one of the most powerful concepts in time analysis: the squaring of time and price.
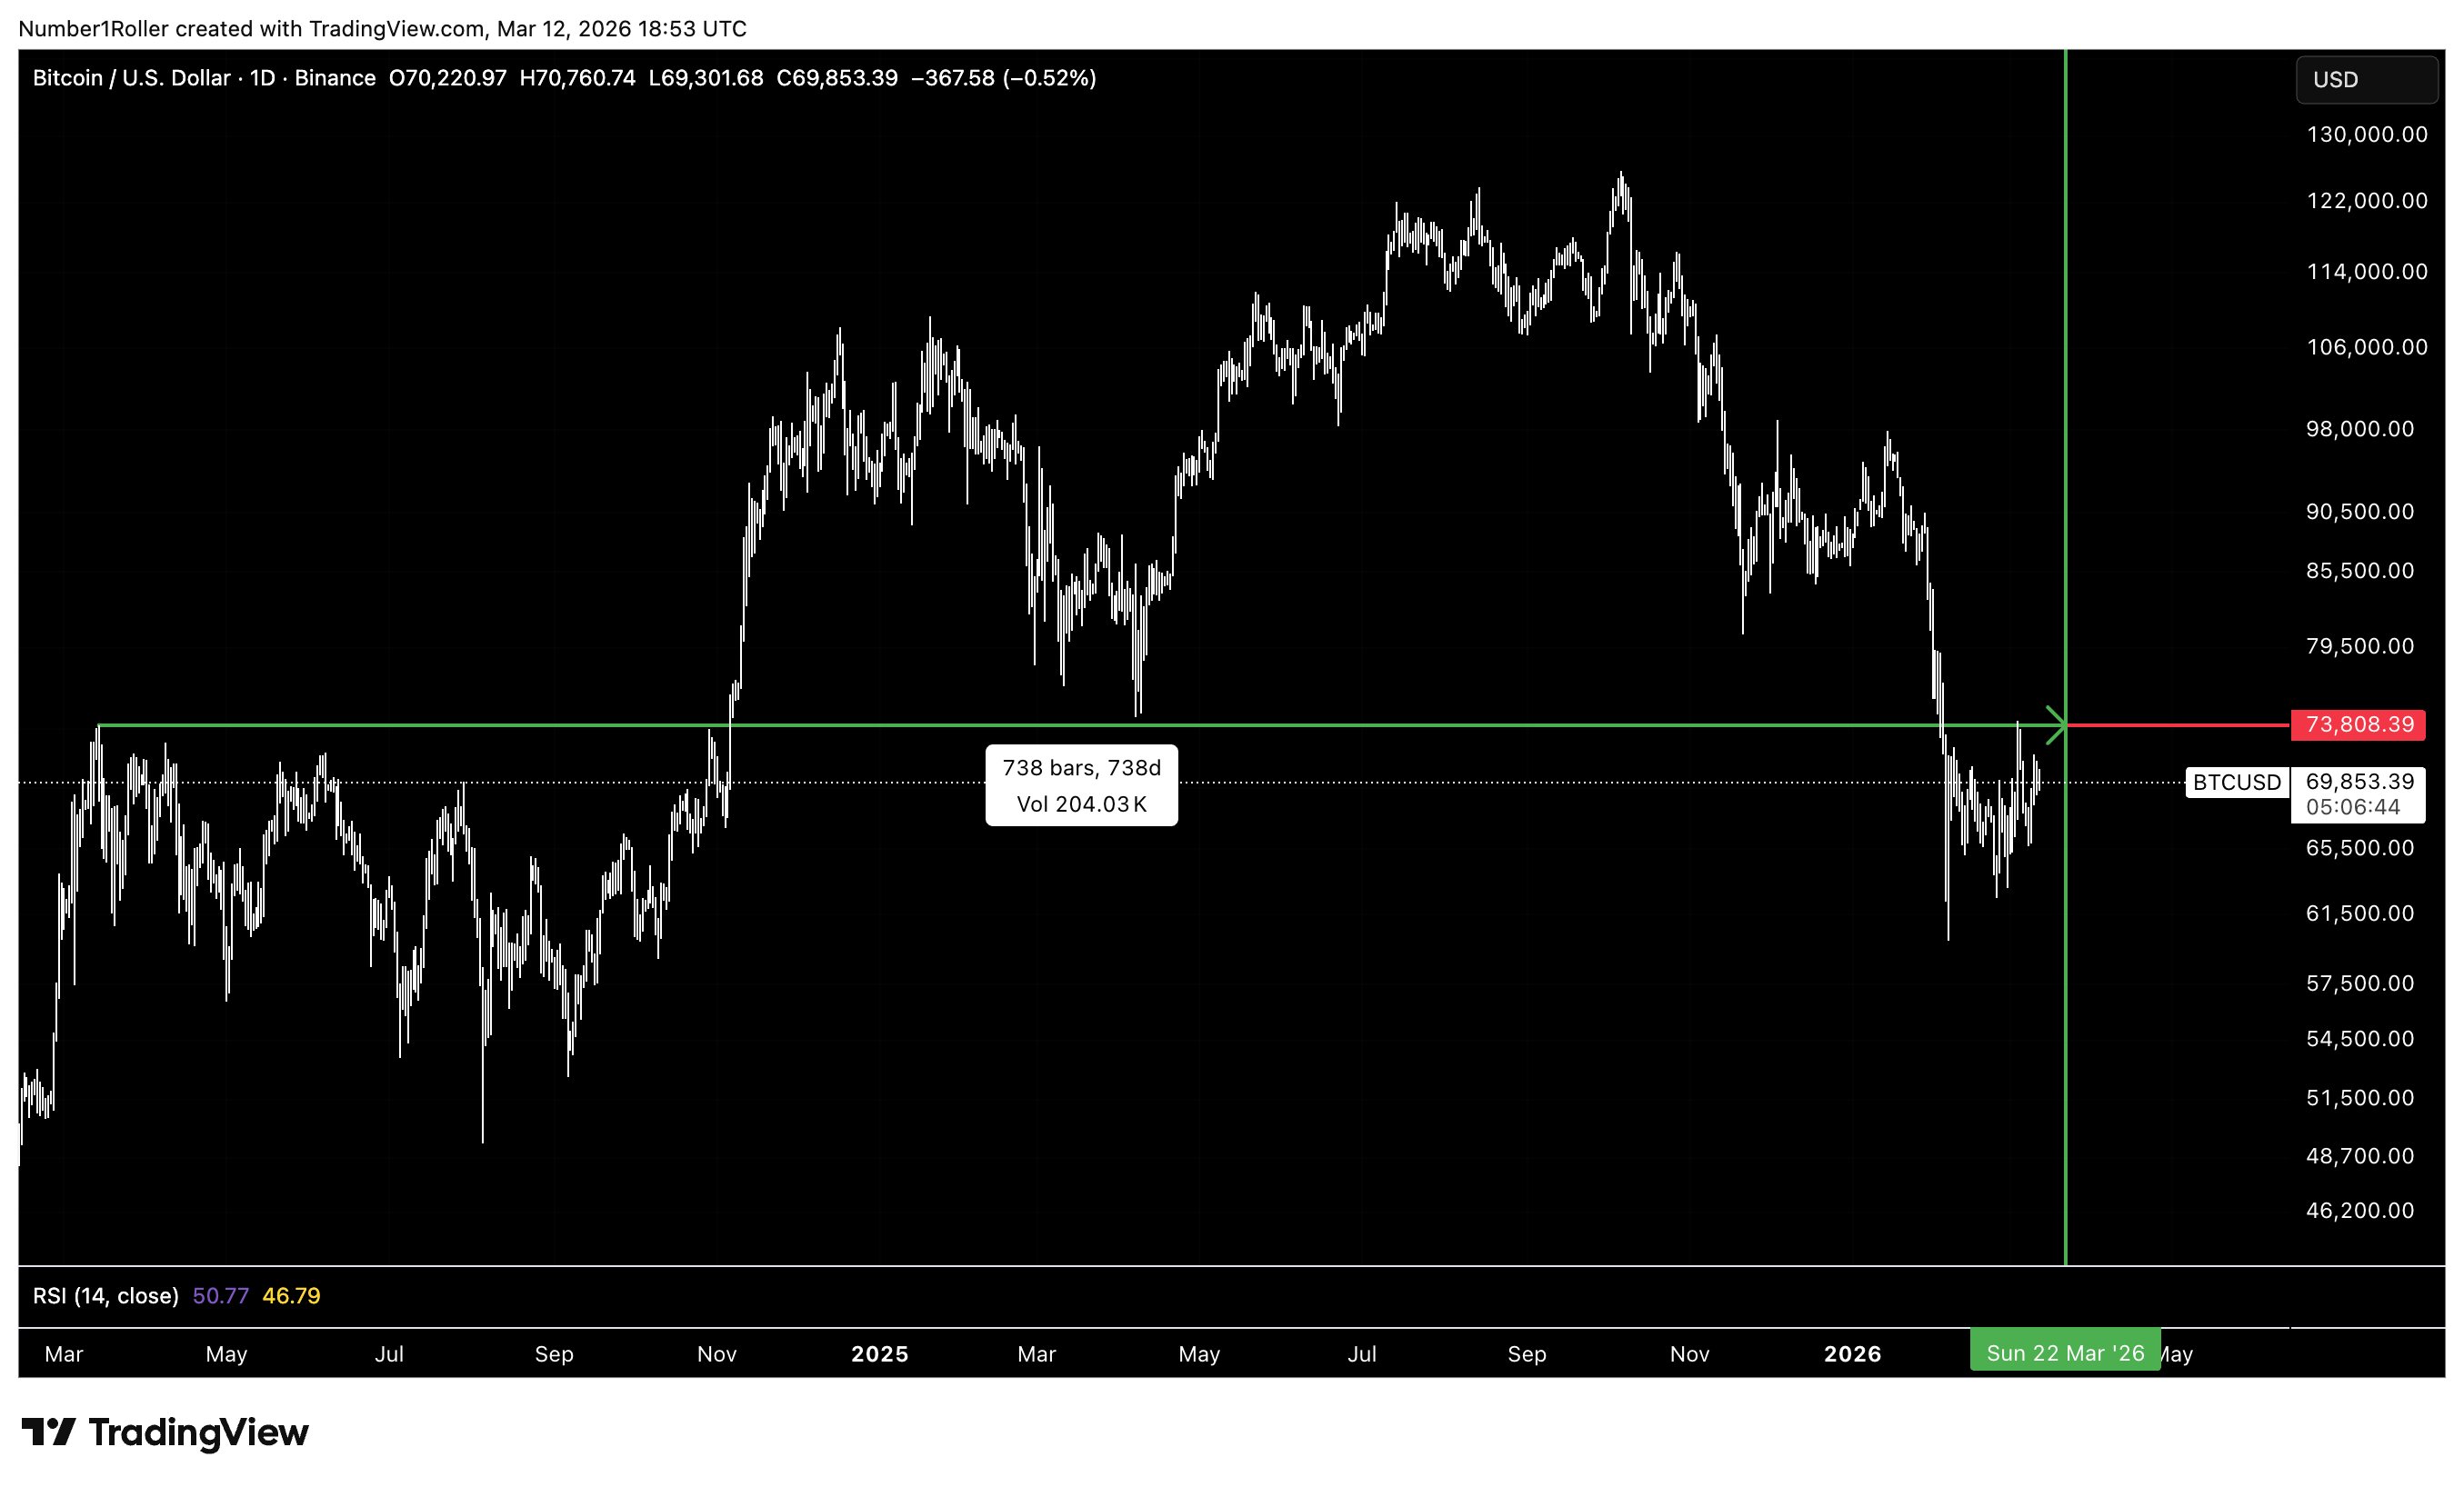
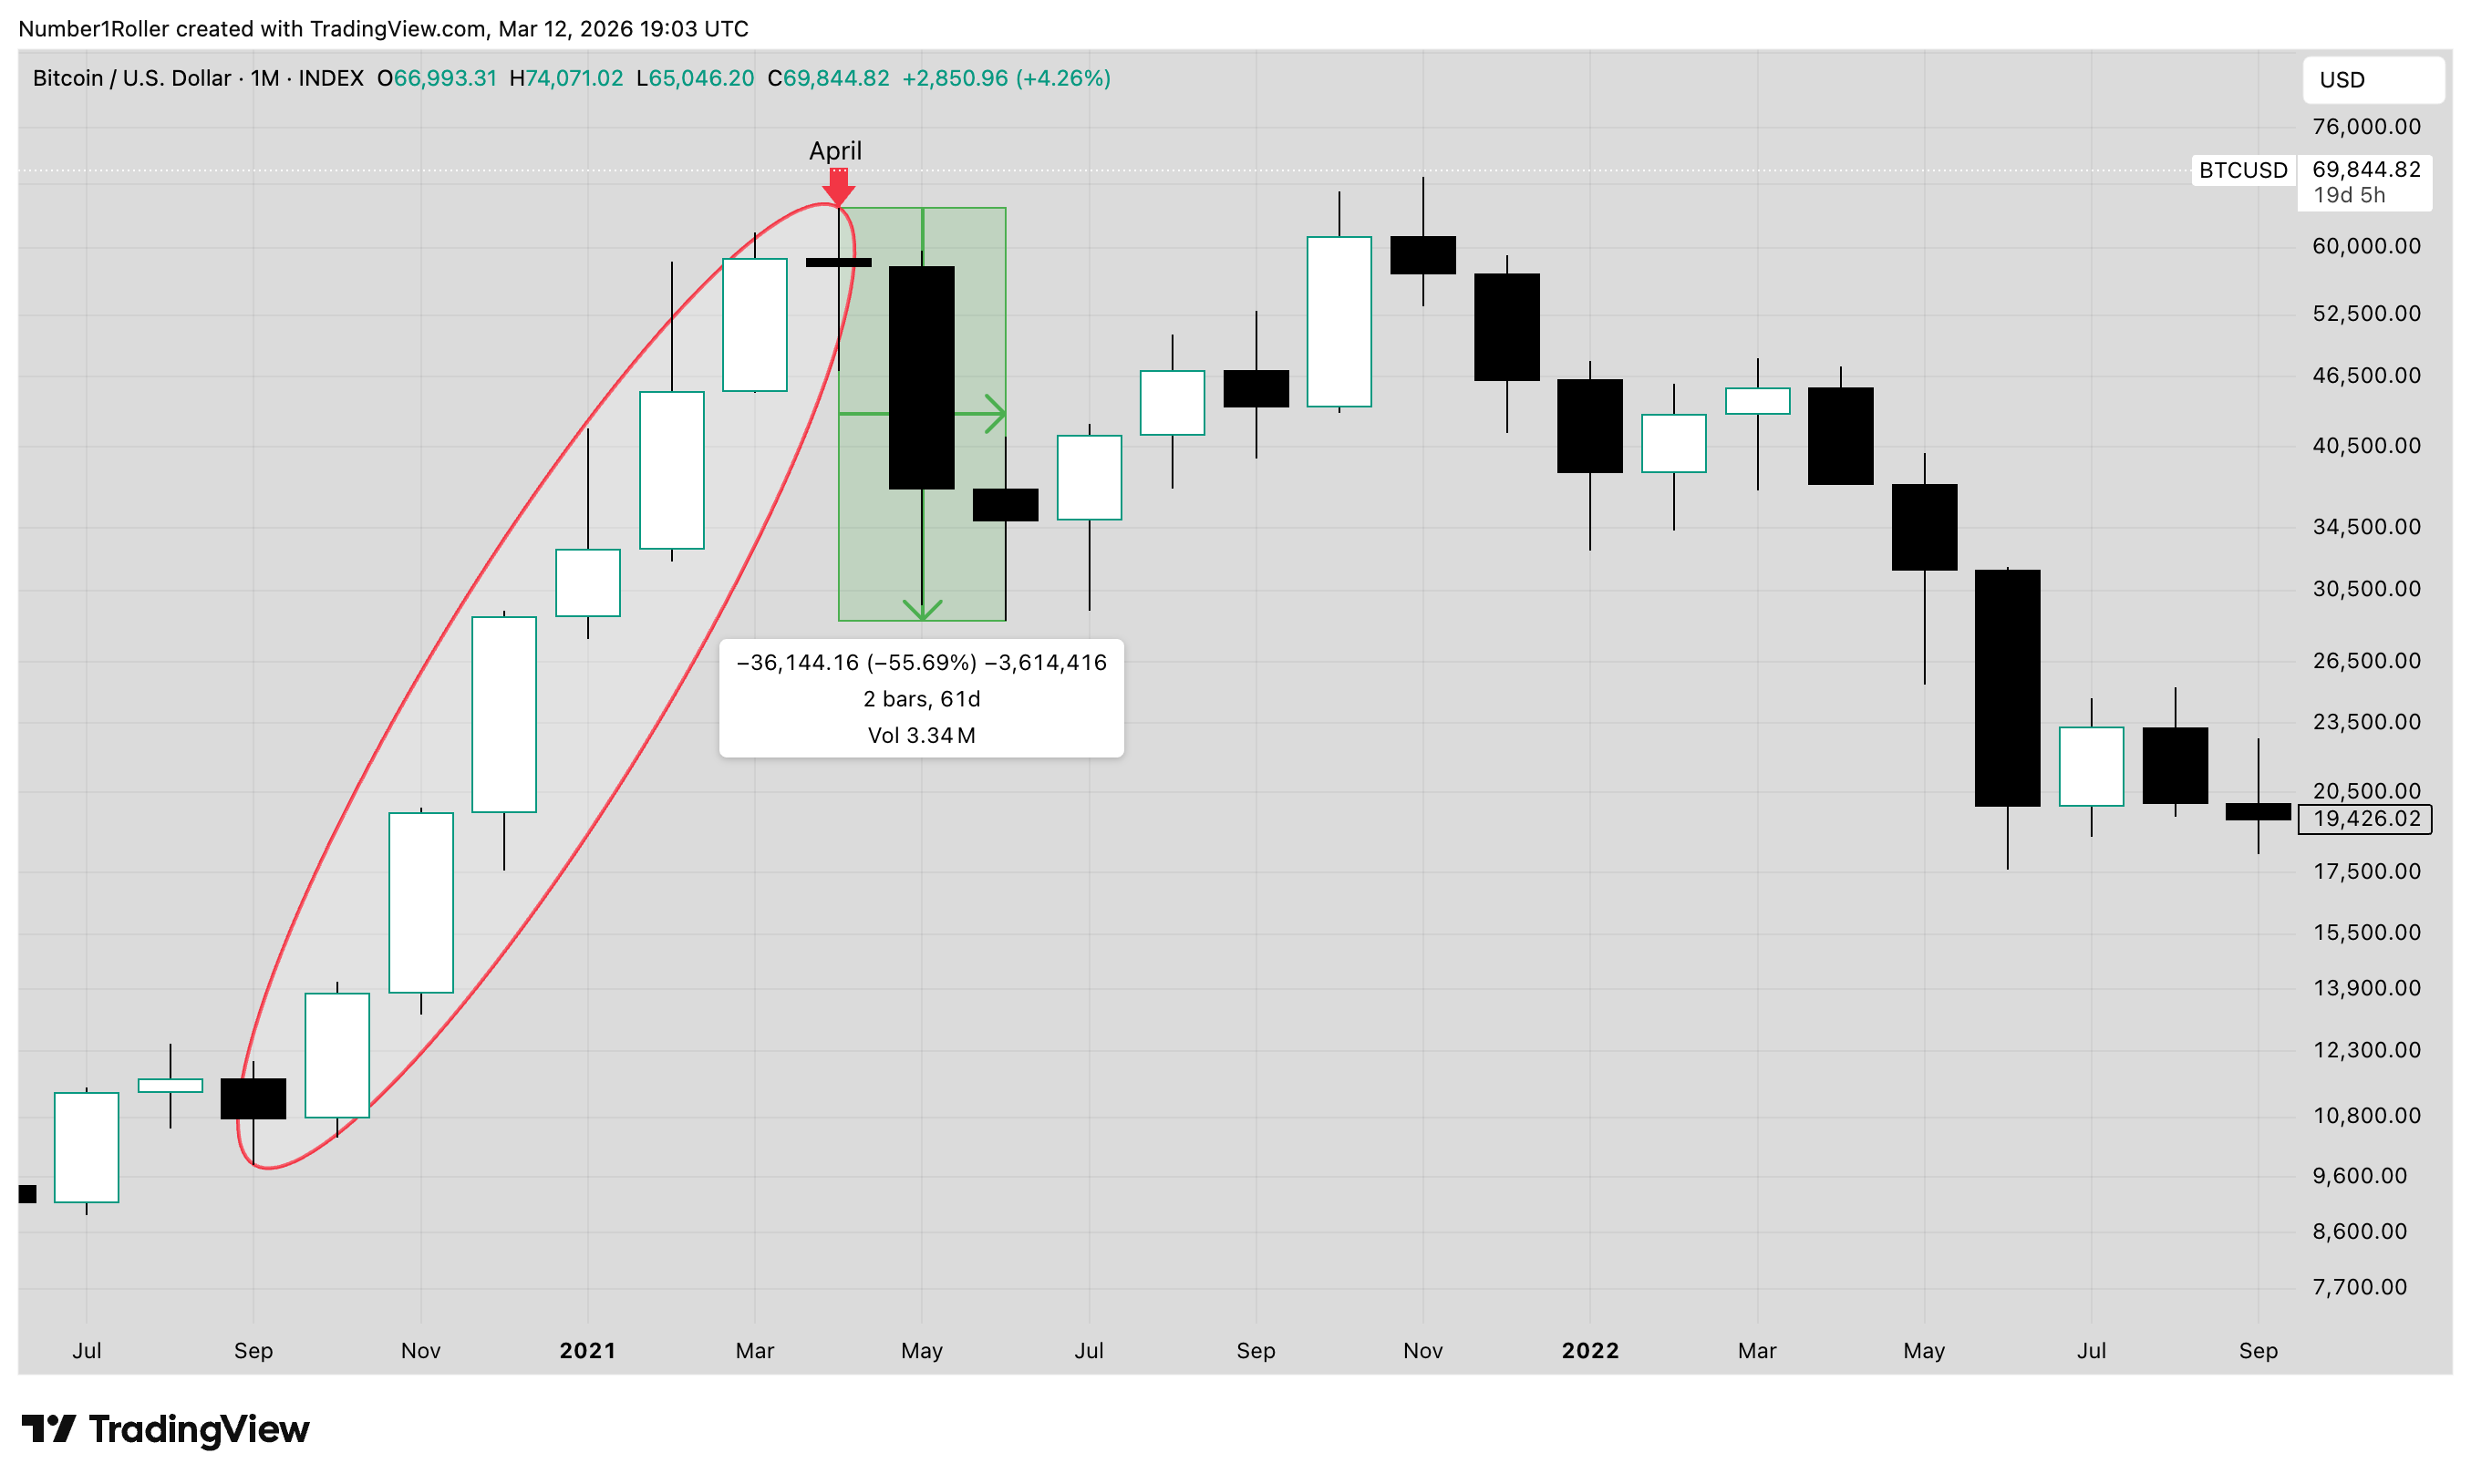
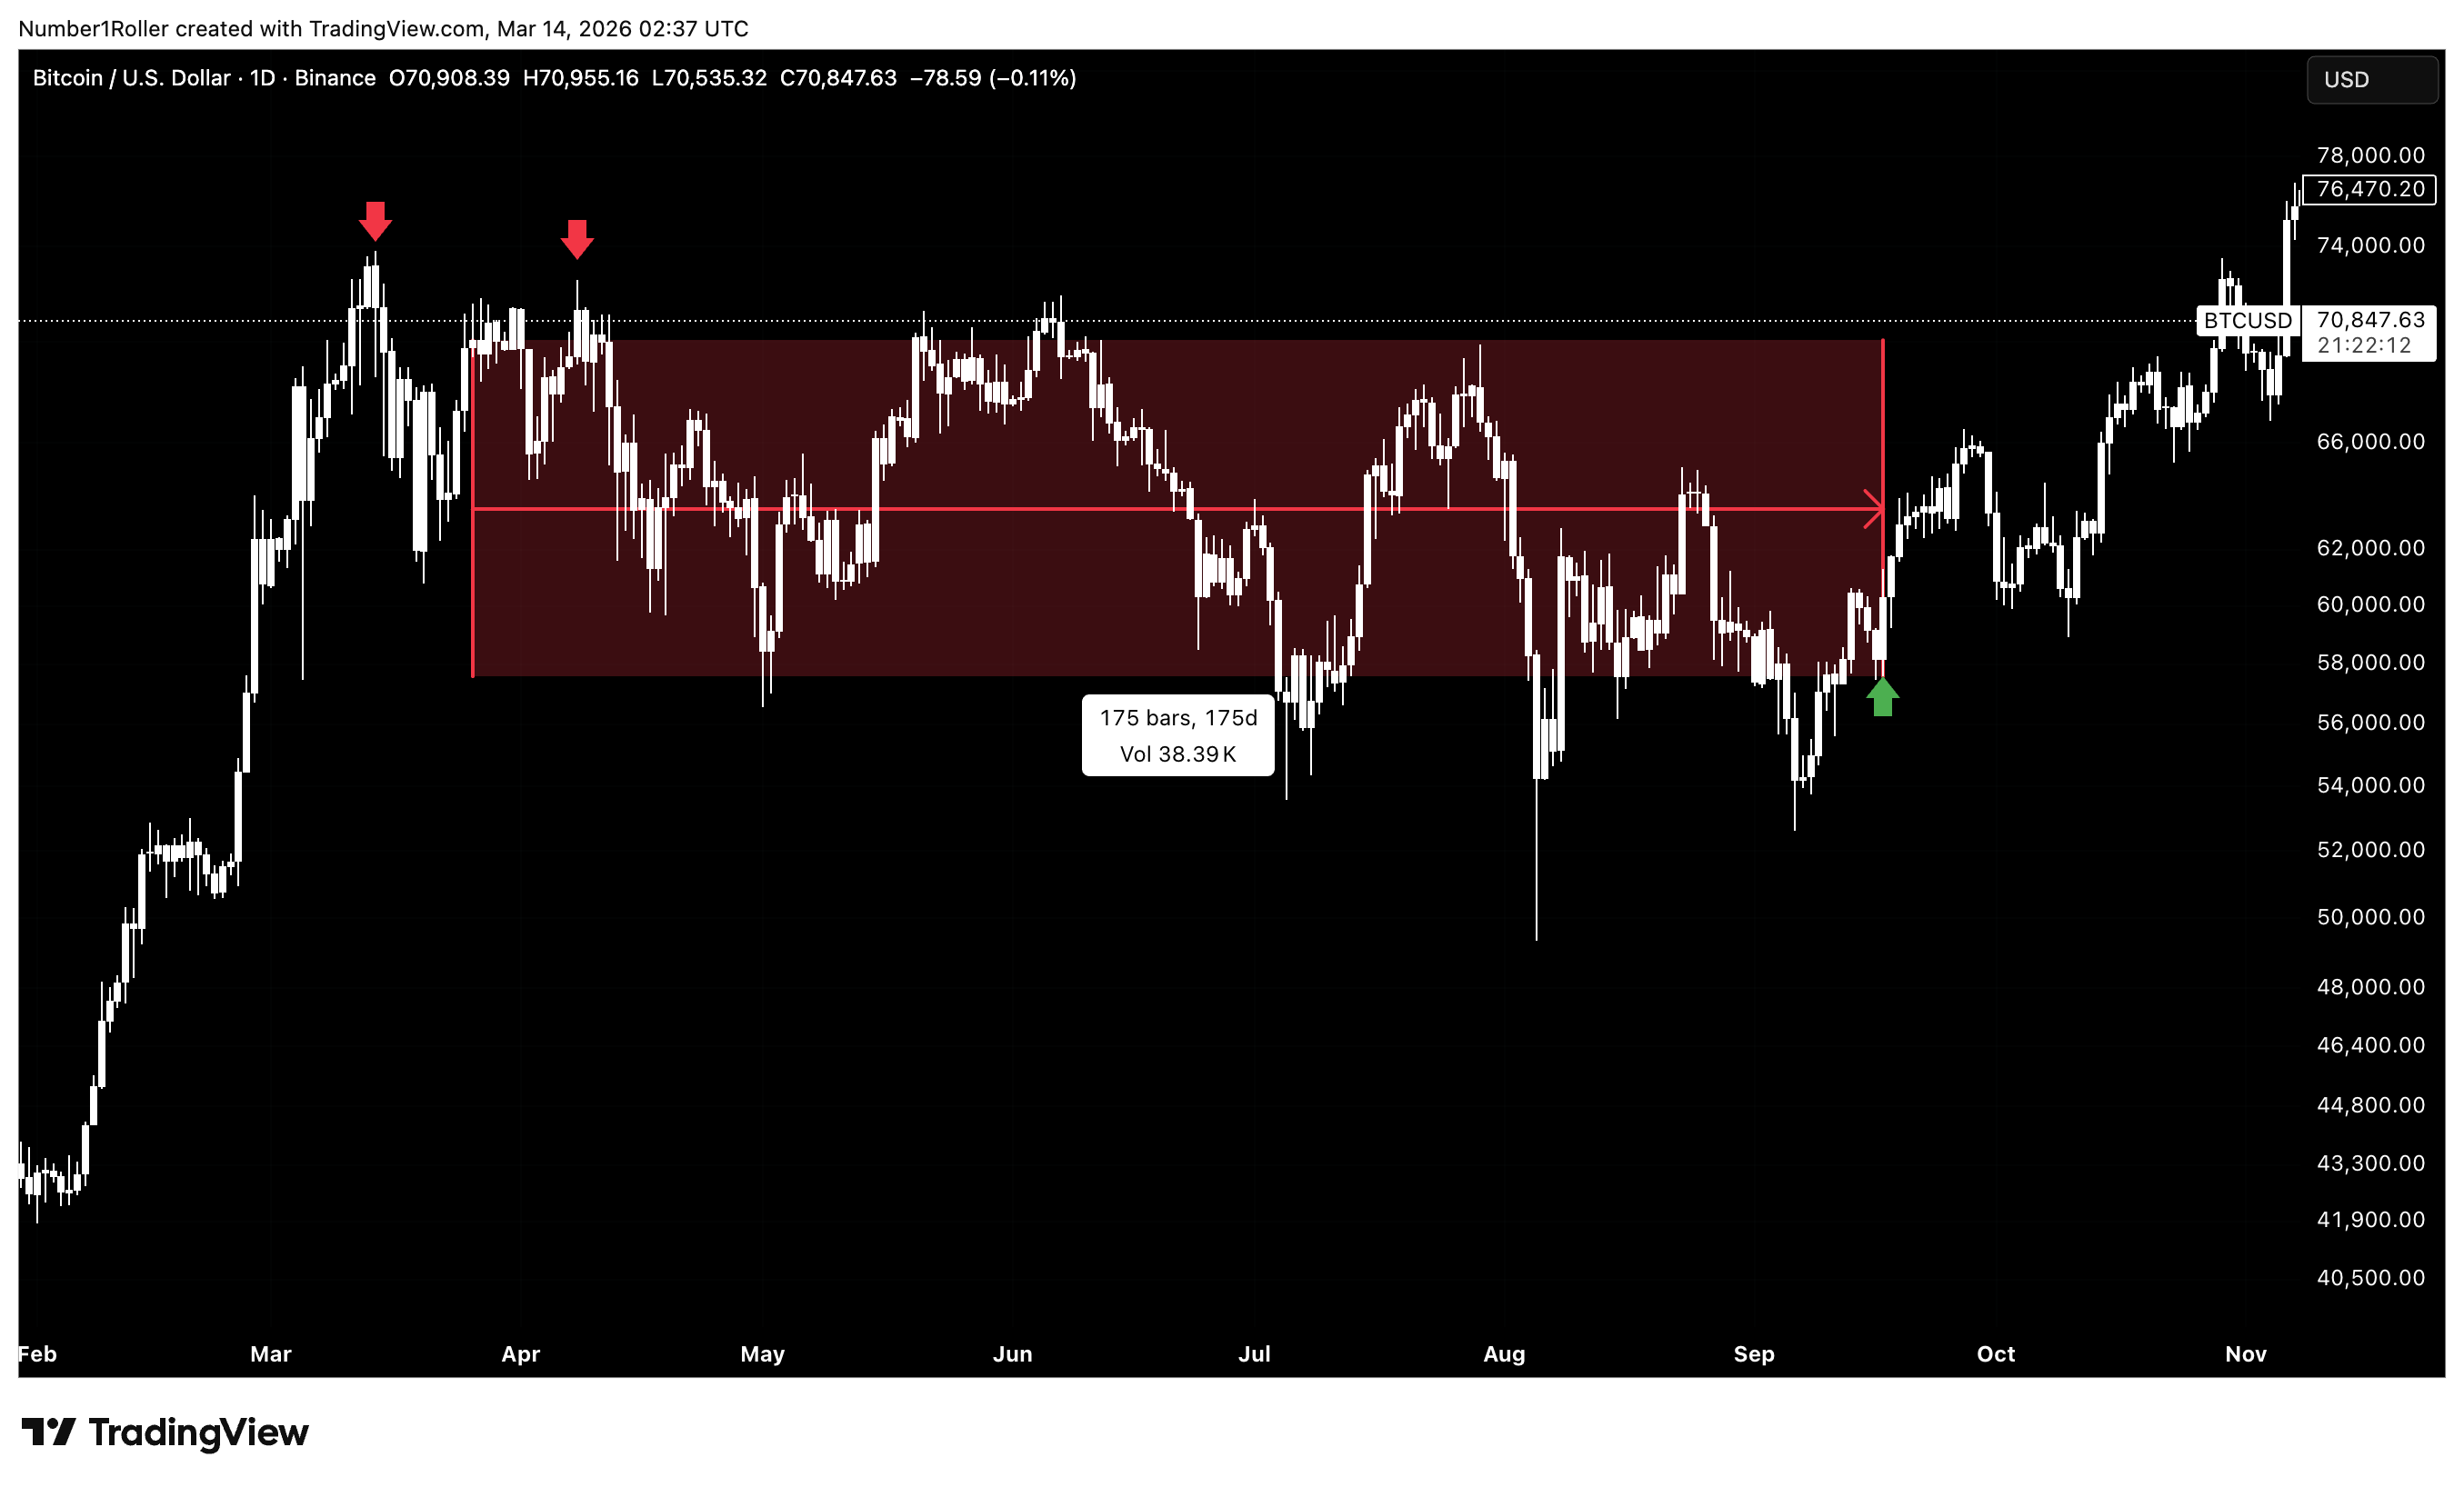
Let’s start with the March 13, 2024 top, which came in at 73,808. Sunday, March 22nd will mark 738 days from that date.
In other words, price becomes time.
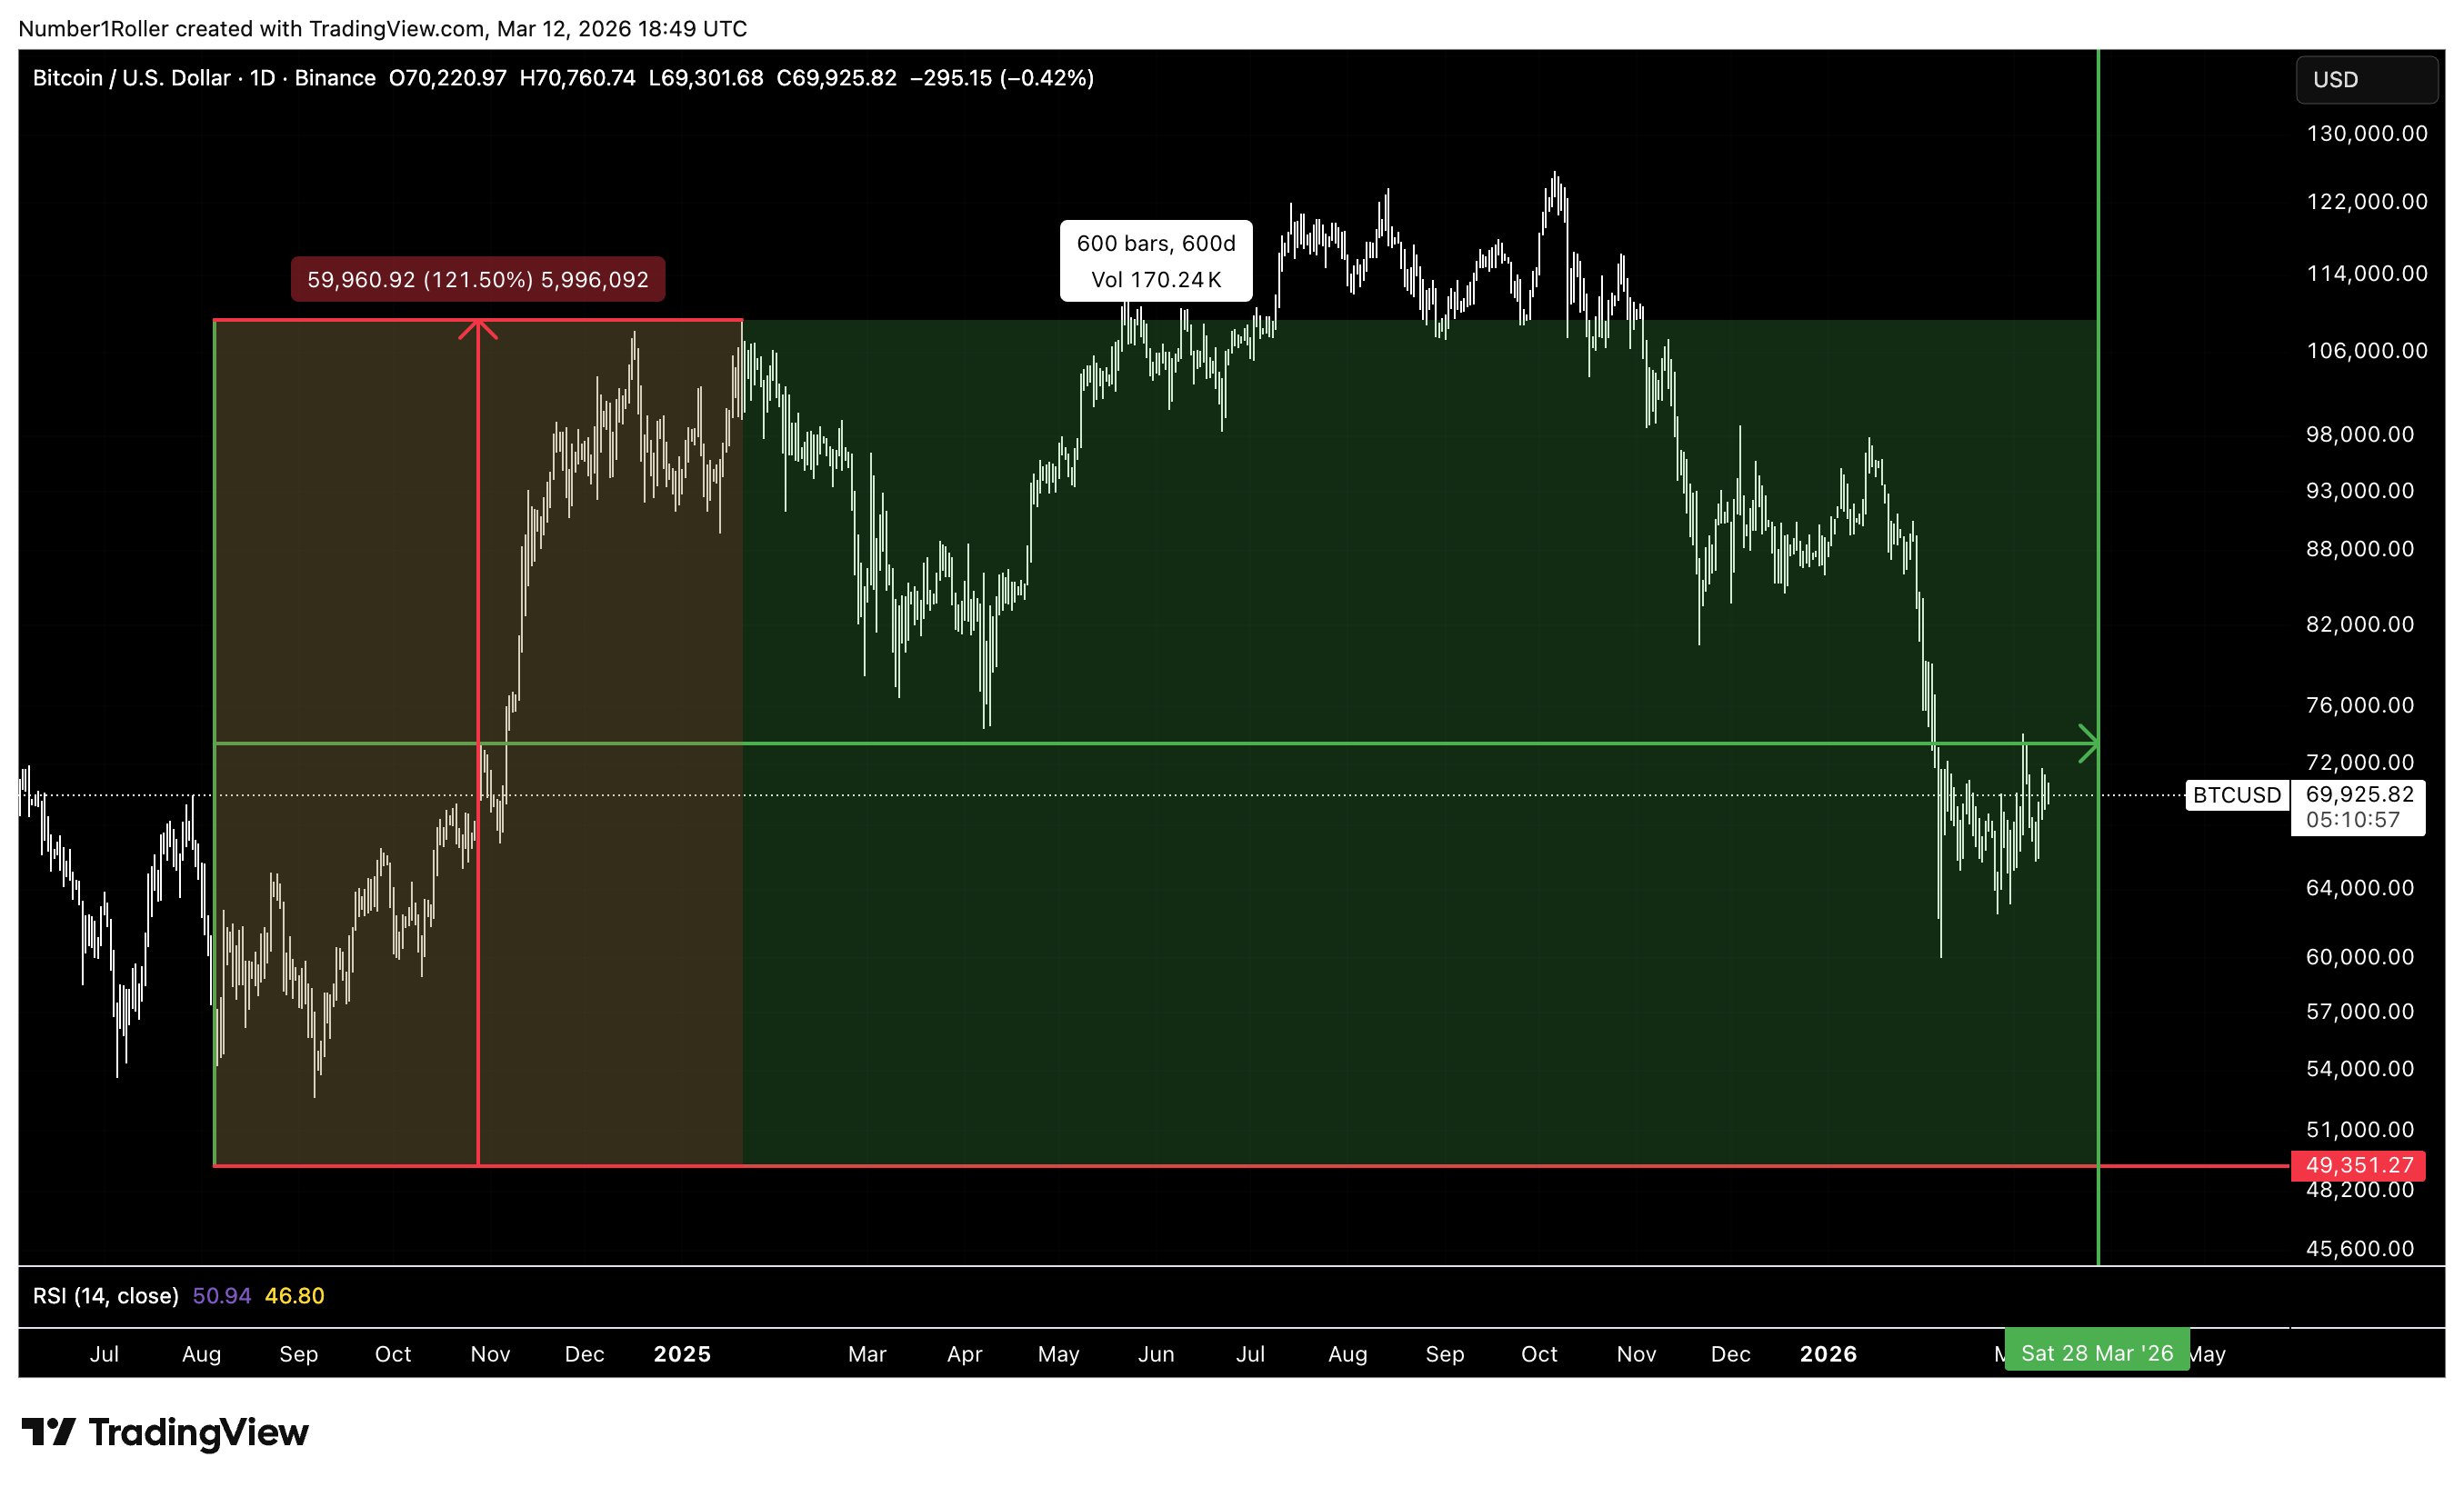
We can also square the range from the August 2024 bottom to the January 2025 top. That range measured 59,960 points — essentially 60,000.
Projecting that forward 600 days brings us directly to March 28th. Notably, 600 days itself is a recognized pressure date.
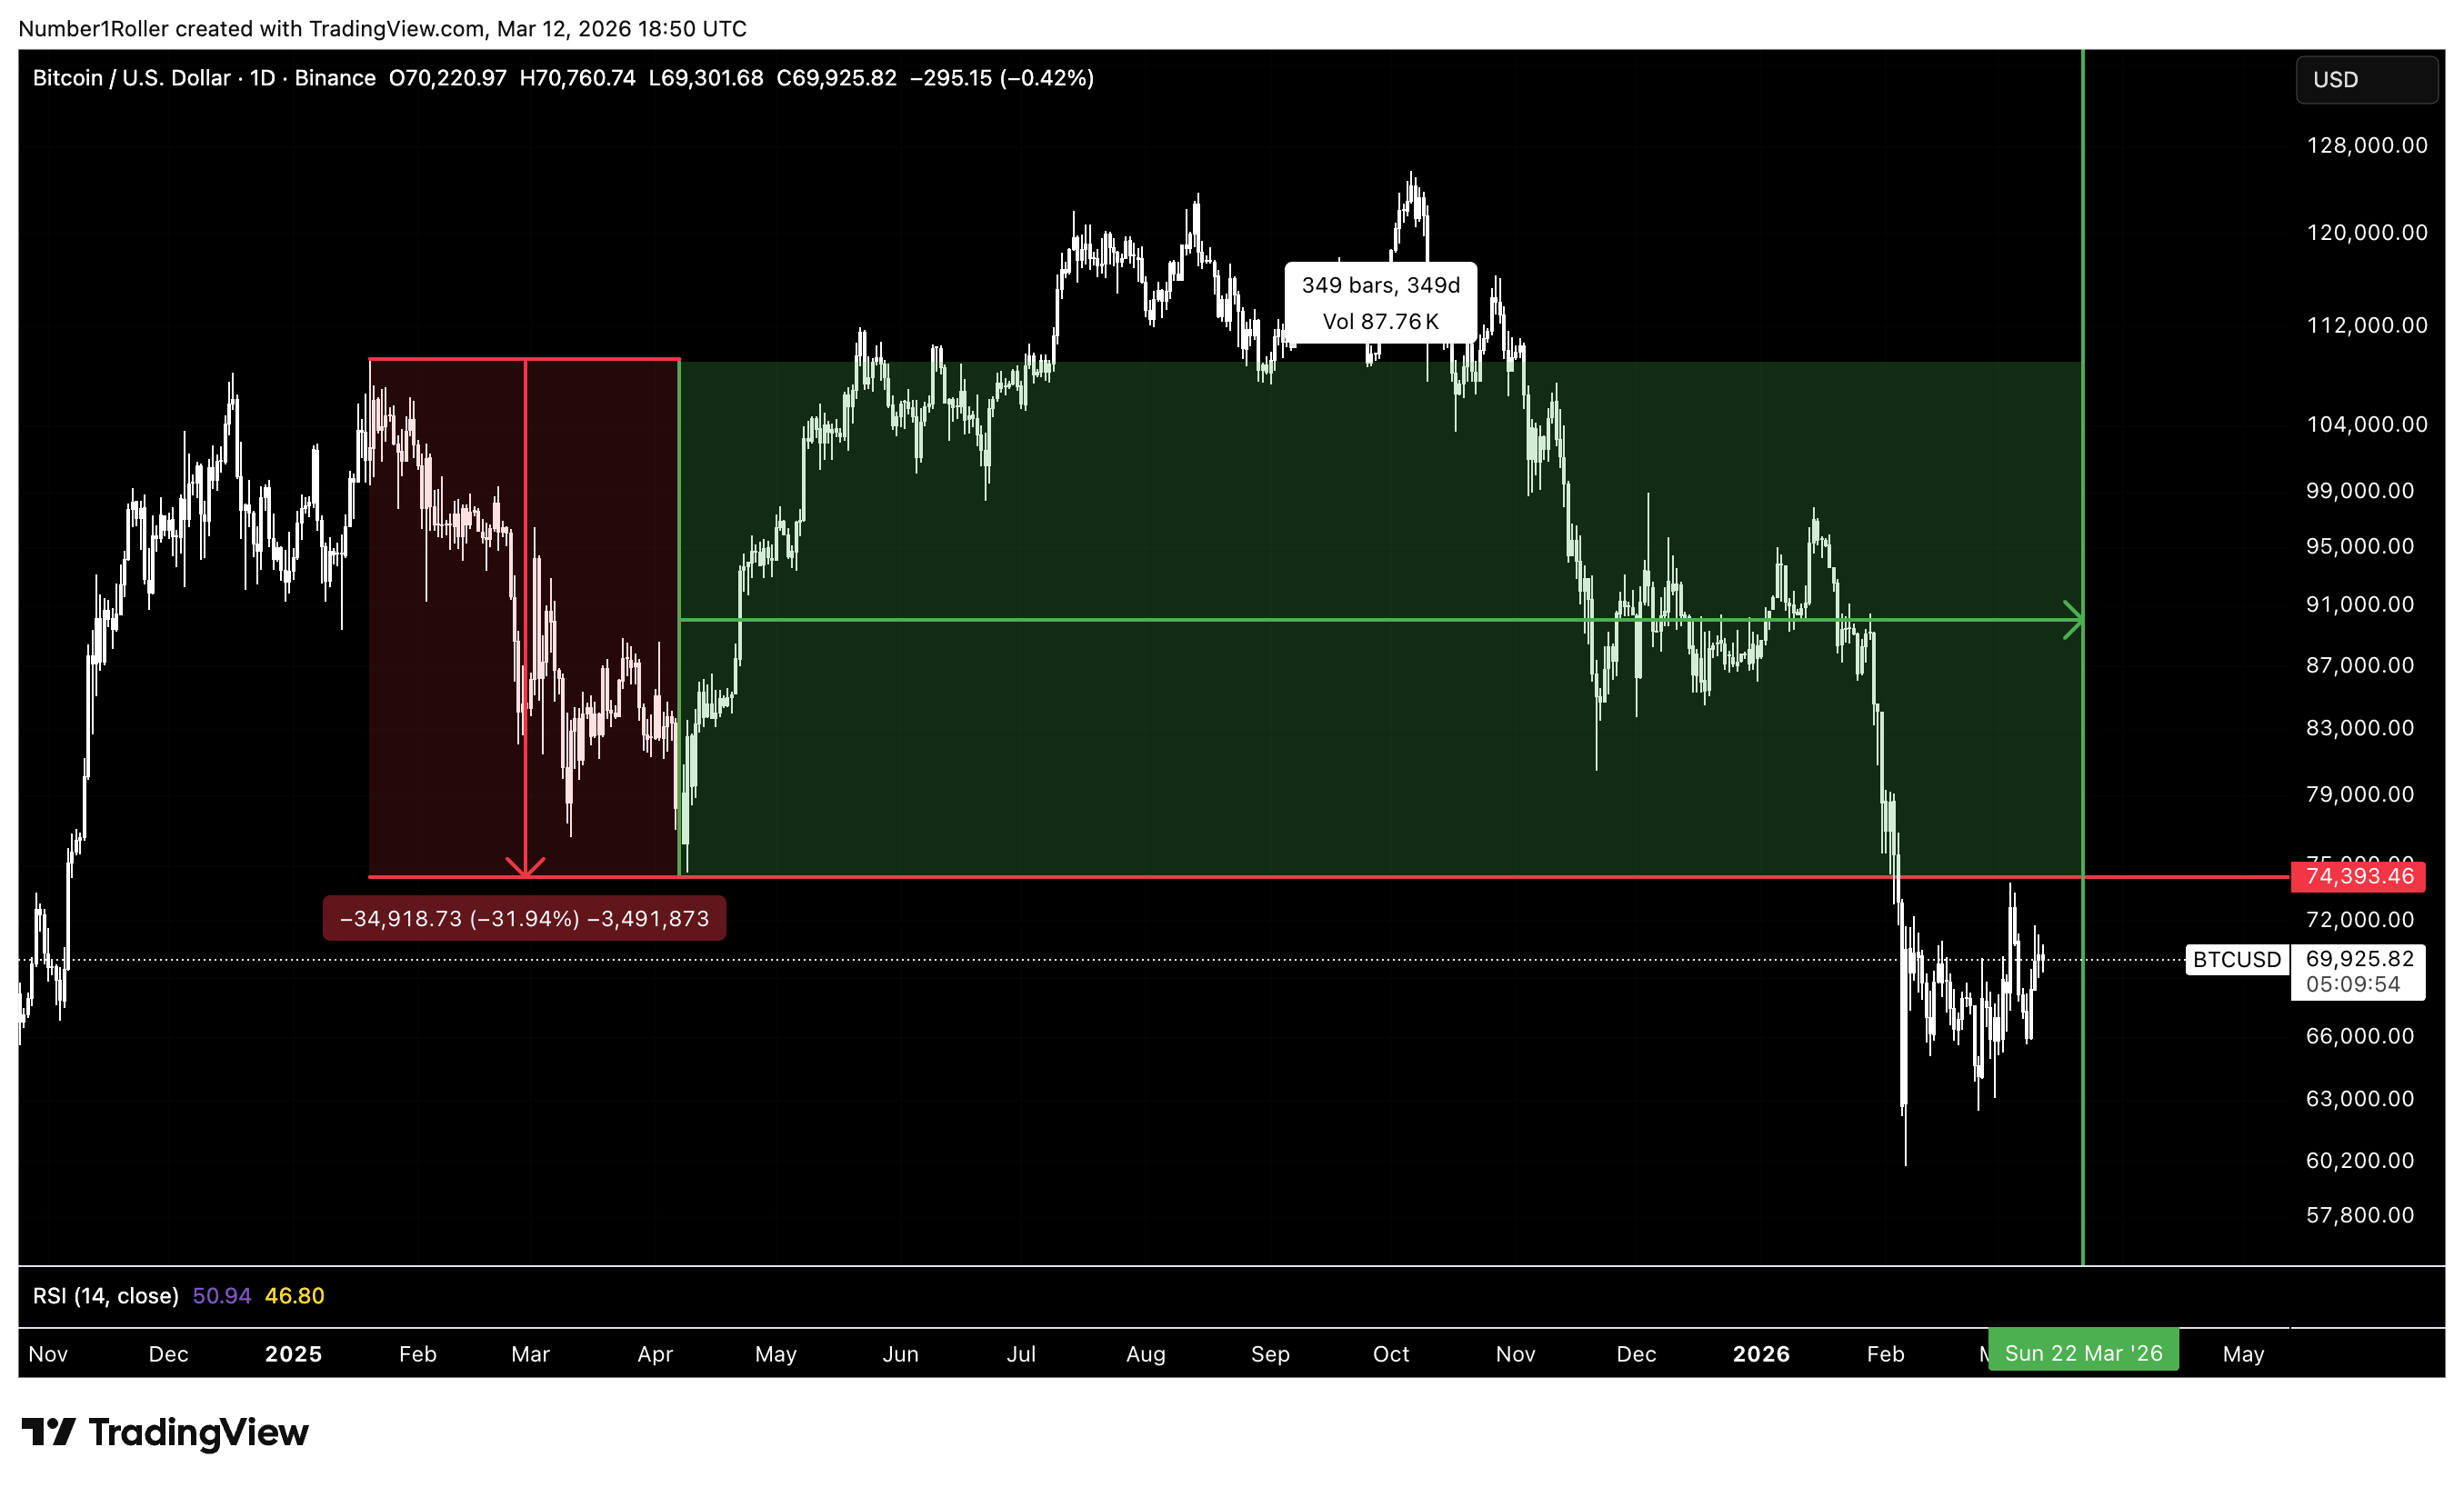
Next, we can square the range from the January 2025 top to the April 2025 low. That decline measured 34,918 points, which translates into a 349-day time window, landing again around March 22nd.
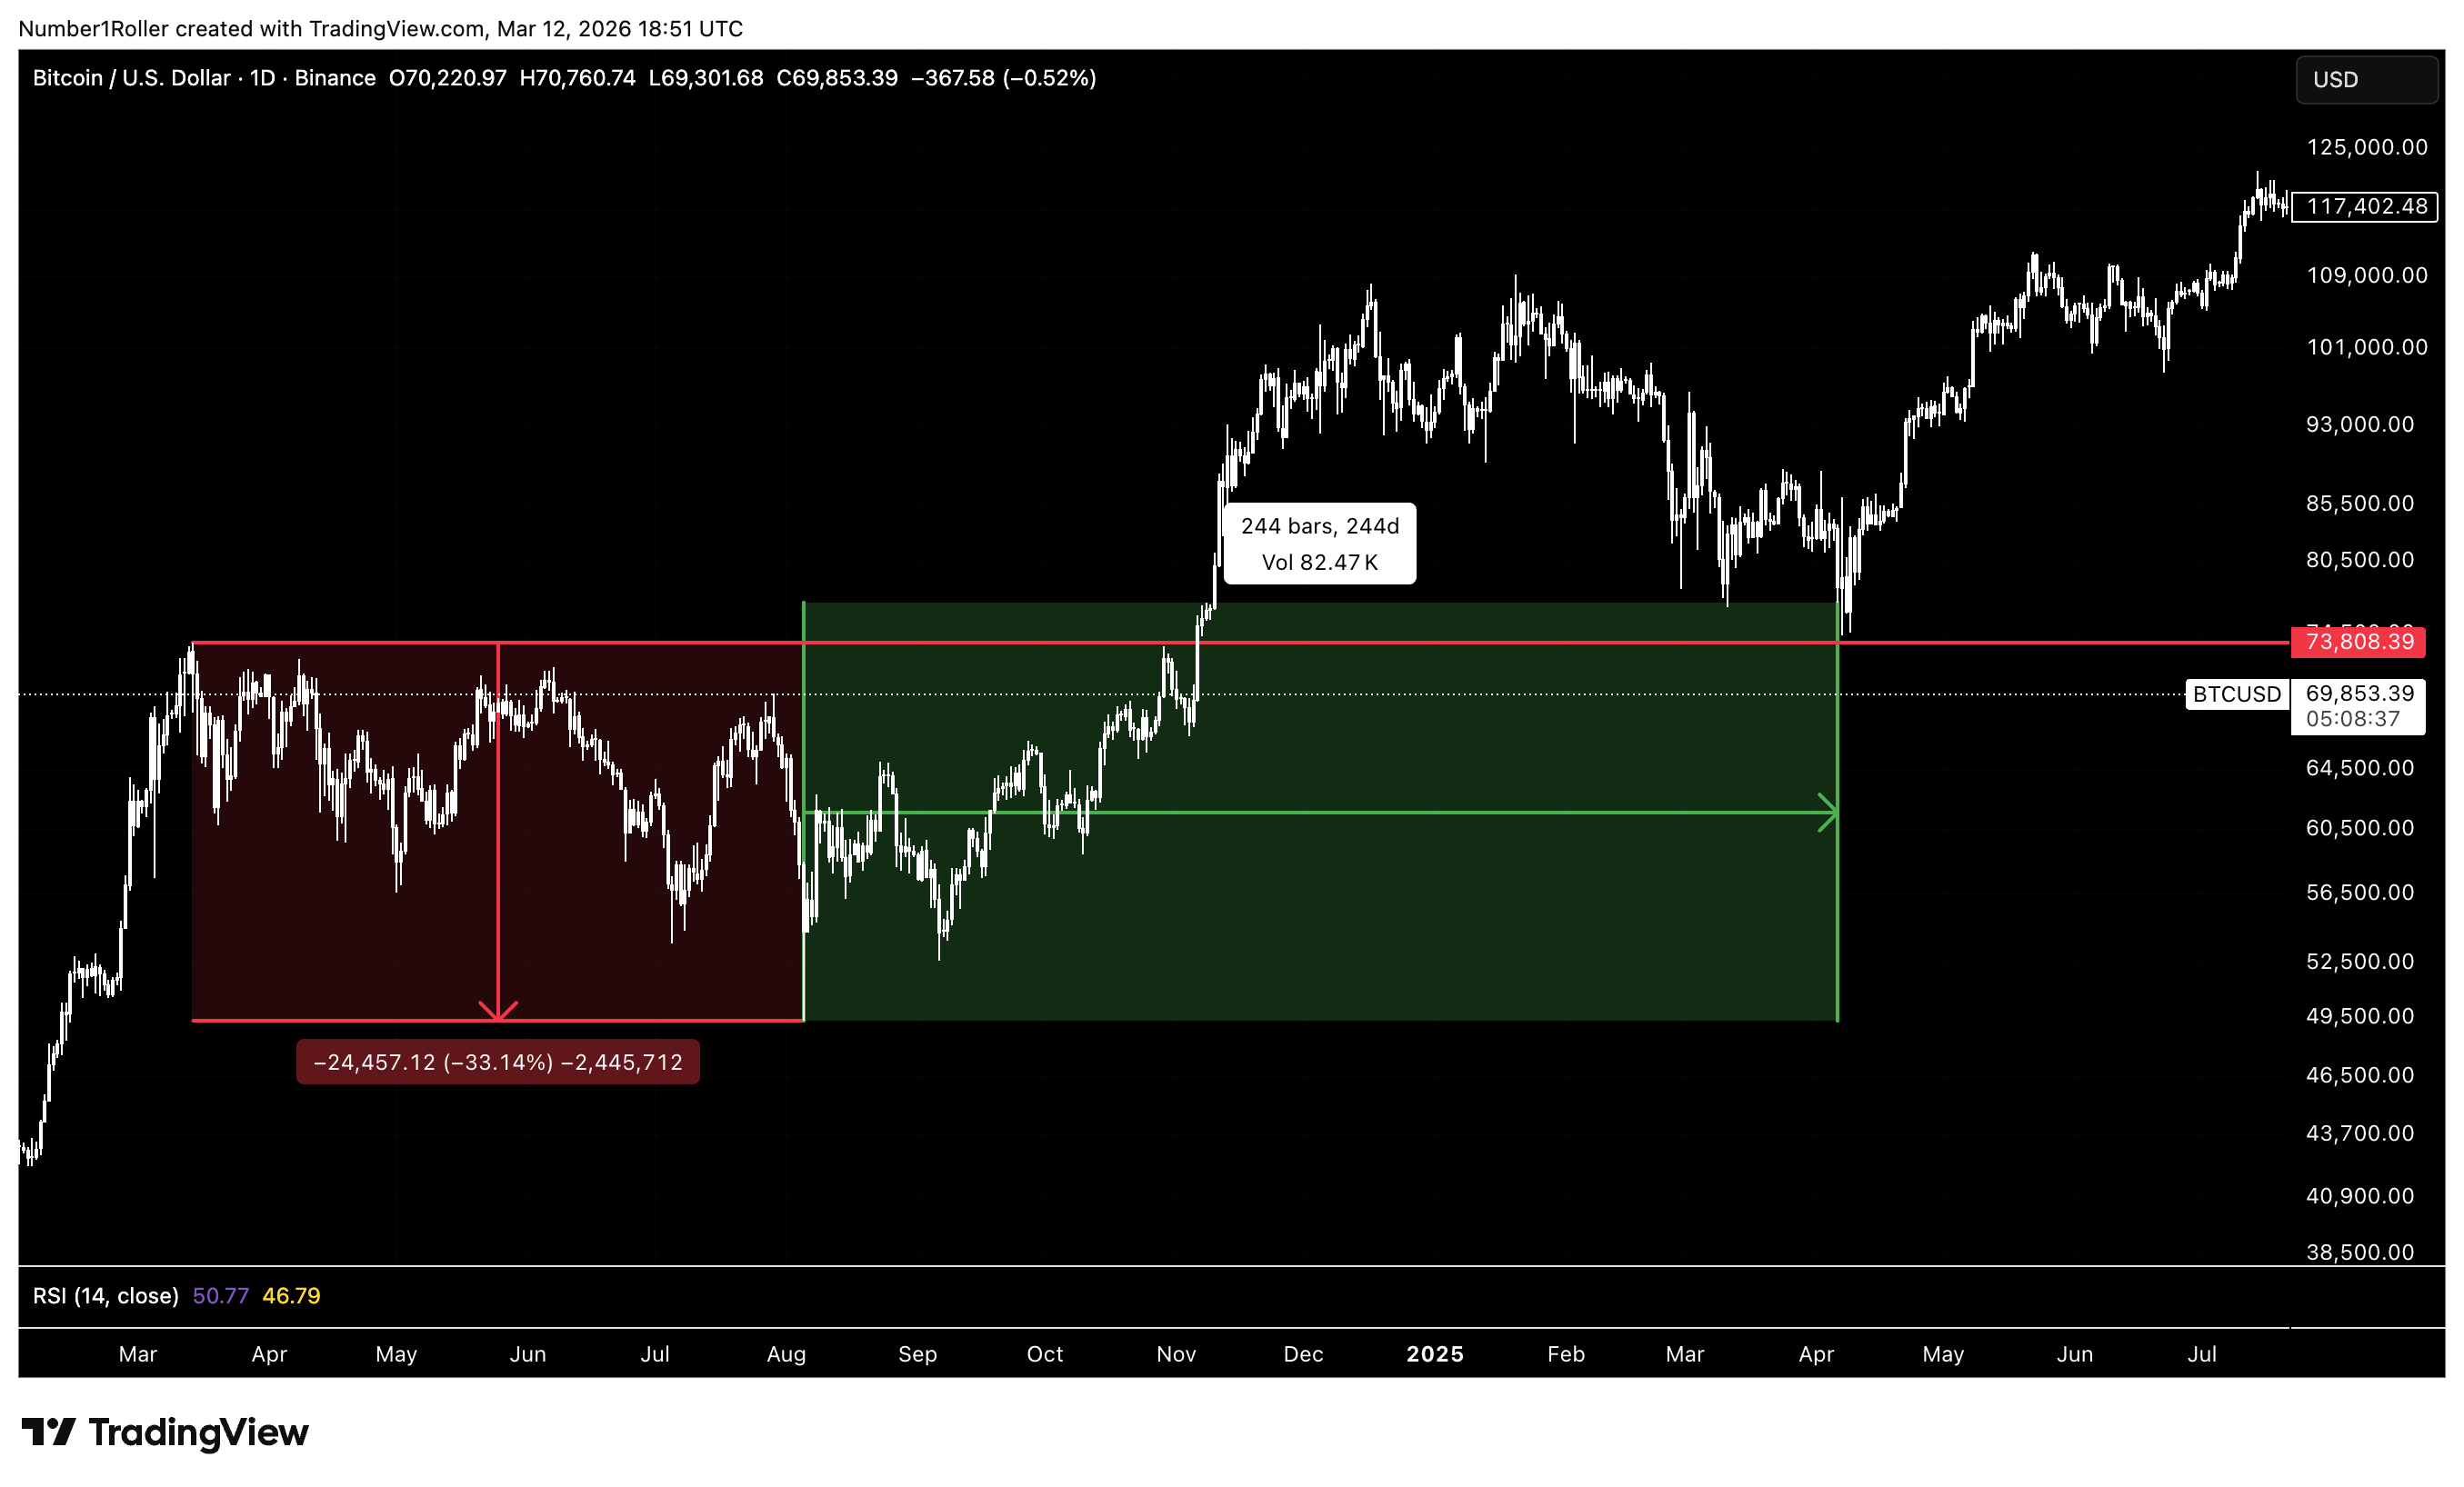
Finally, just to demonstrate how powerful this concept can be, let’s go back and square the decline from the March 2024 top to the August 2024 low.
That drop measured 24,457 points. Rounded to 245 days, it lands on the exact date of the April 2025 bottom.
Pretty powerful stuff.
Individually these signals would be interesting. But when they begin appearing together like this, the implications become much more significant
A Rare Confluence of Time and Price
In the years I’ve been studying this markets, I’ve rarely seen such a strong confluence between time and price relationships.
Taken together, the entire annual cycle from March 2024 through April 2025 appears to be pointing directly at this late March / early April window as a moment of major importance.
It’s also worth revisiting a few key points from our annual report.
When we examine the month of March historically, several important patterns emerge:
March is the first month with a monthly time factor that has produced a major low
The 60-day, 60-week, and 60-month cycles all appear to play an important role in this market
And notably, four out of the five time factors in this study produced lows, meaning the major probabilities suggest a low.
The Case for a Major April Low
Initially, I believed the November low might mark the bottom. That was the basis of my earlier outlook.
Clearly, that didn’t play out.
But that’s part of the process. Since then, I’ve been hesitant to call another bottom because we simply hadn’t seen a strong enough time window to support it.
Until now.
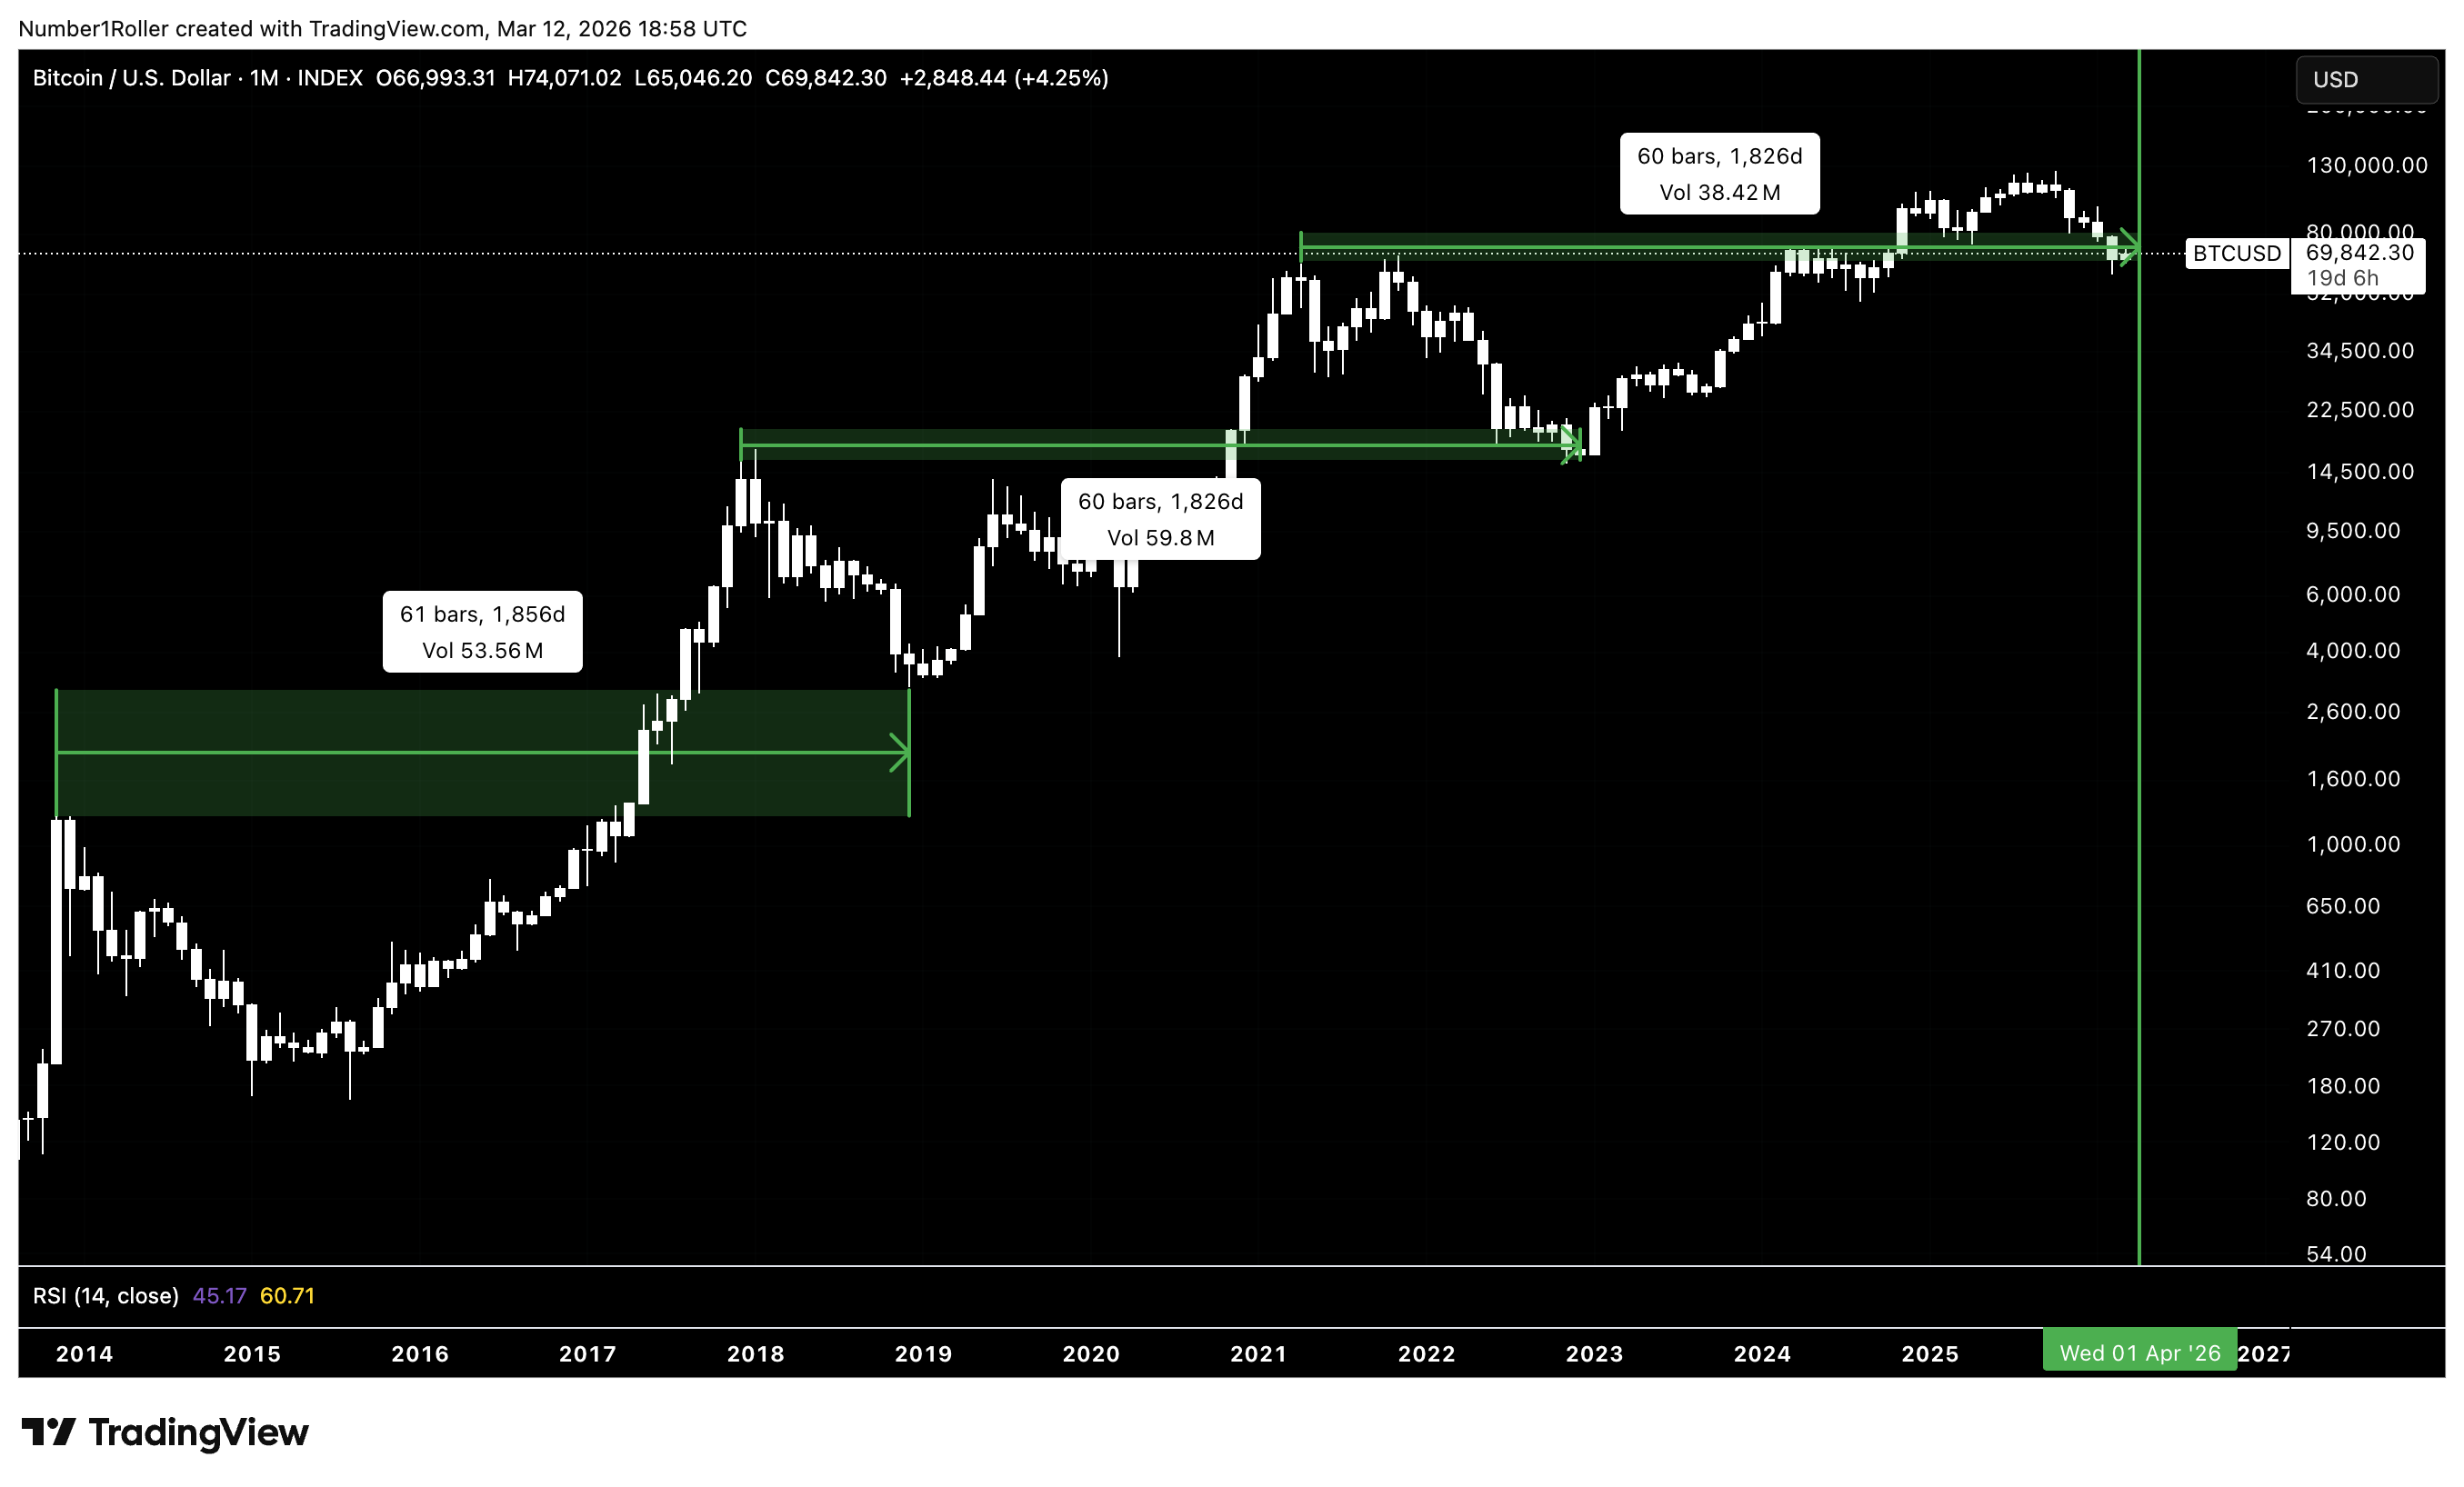
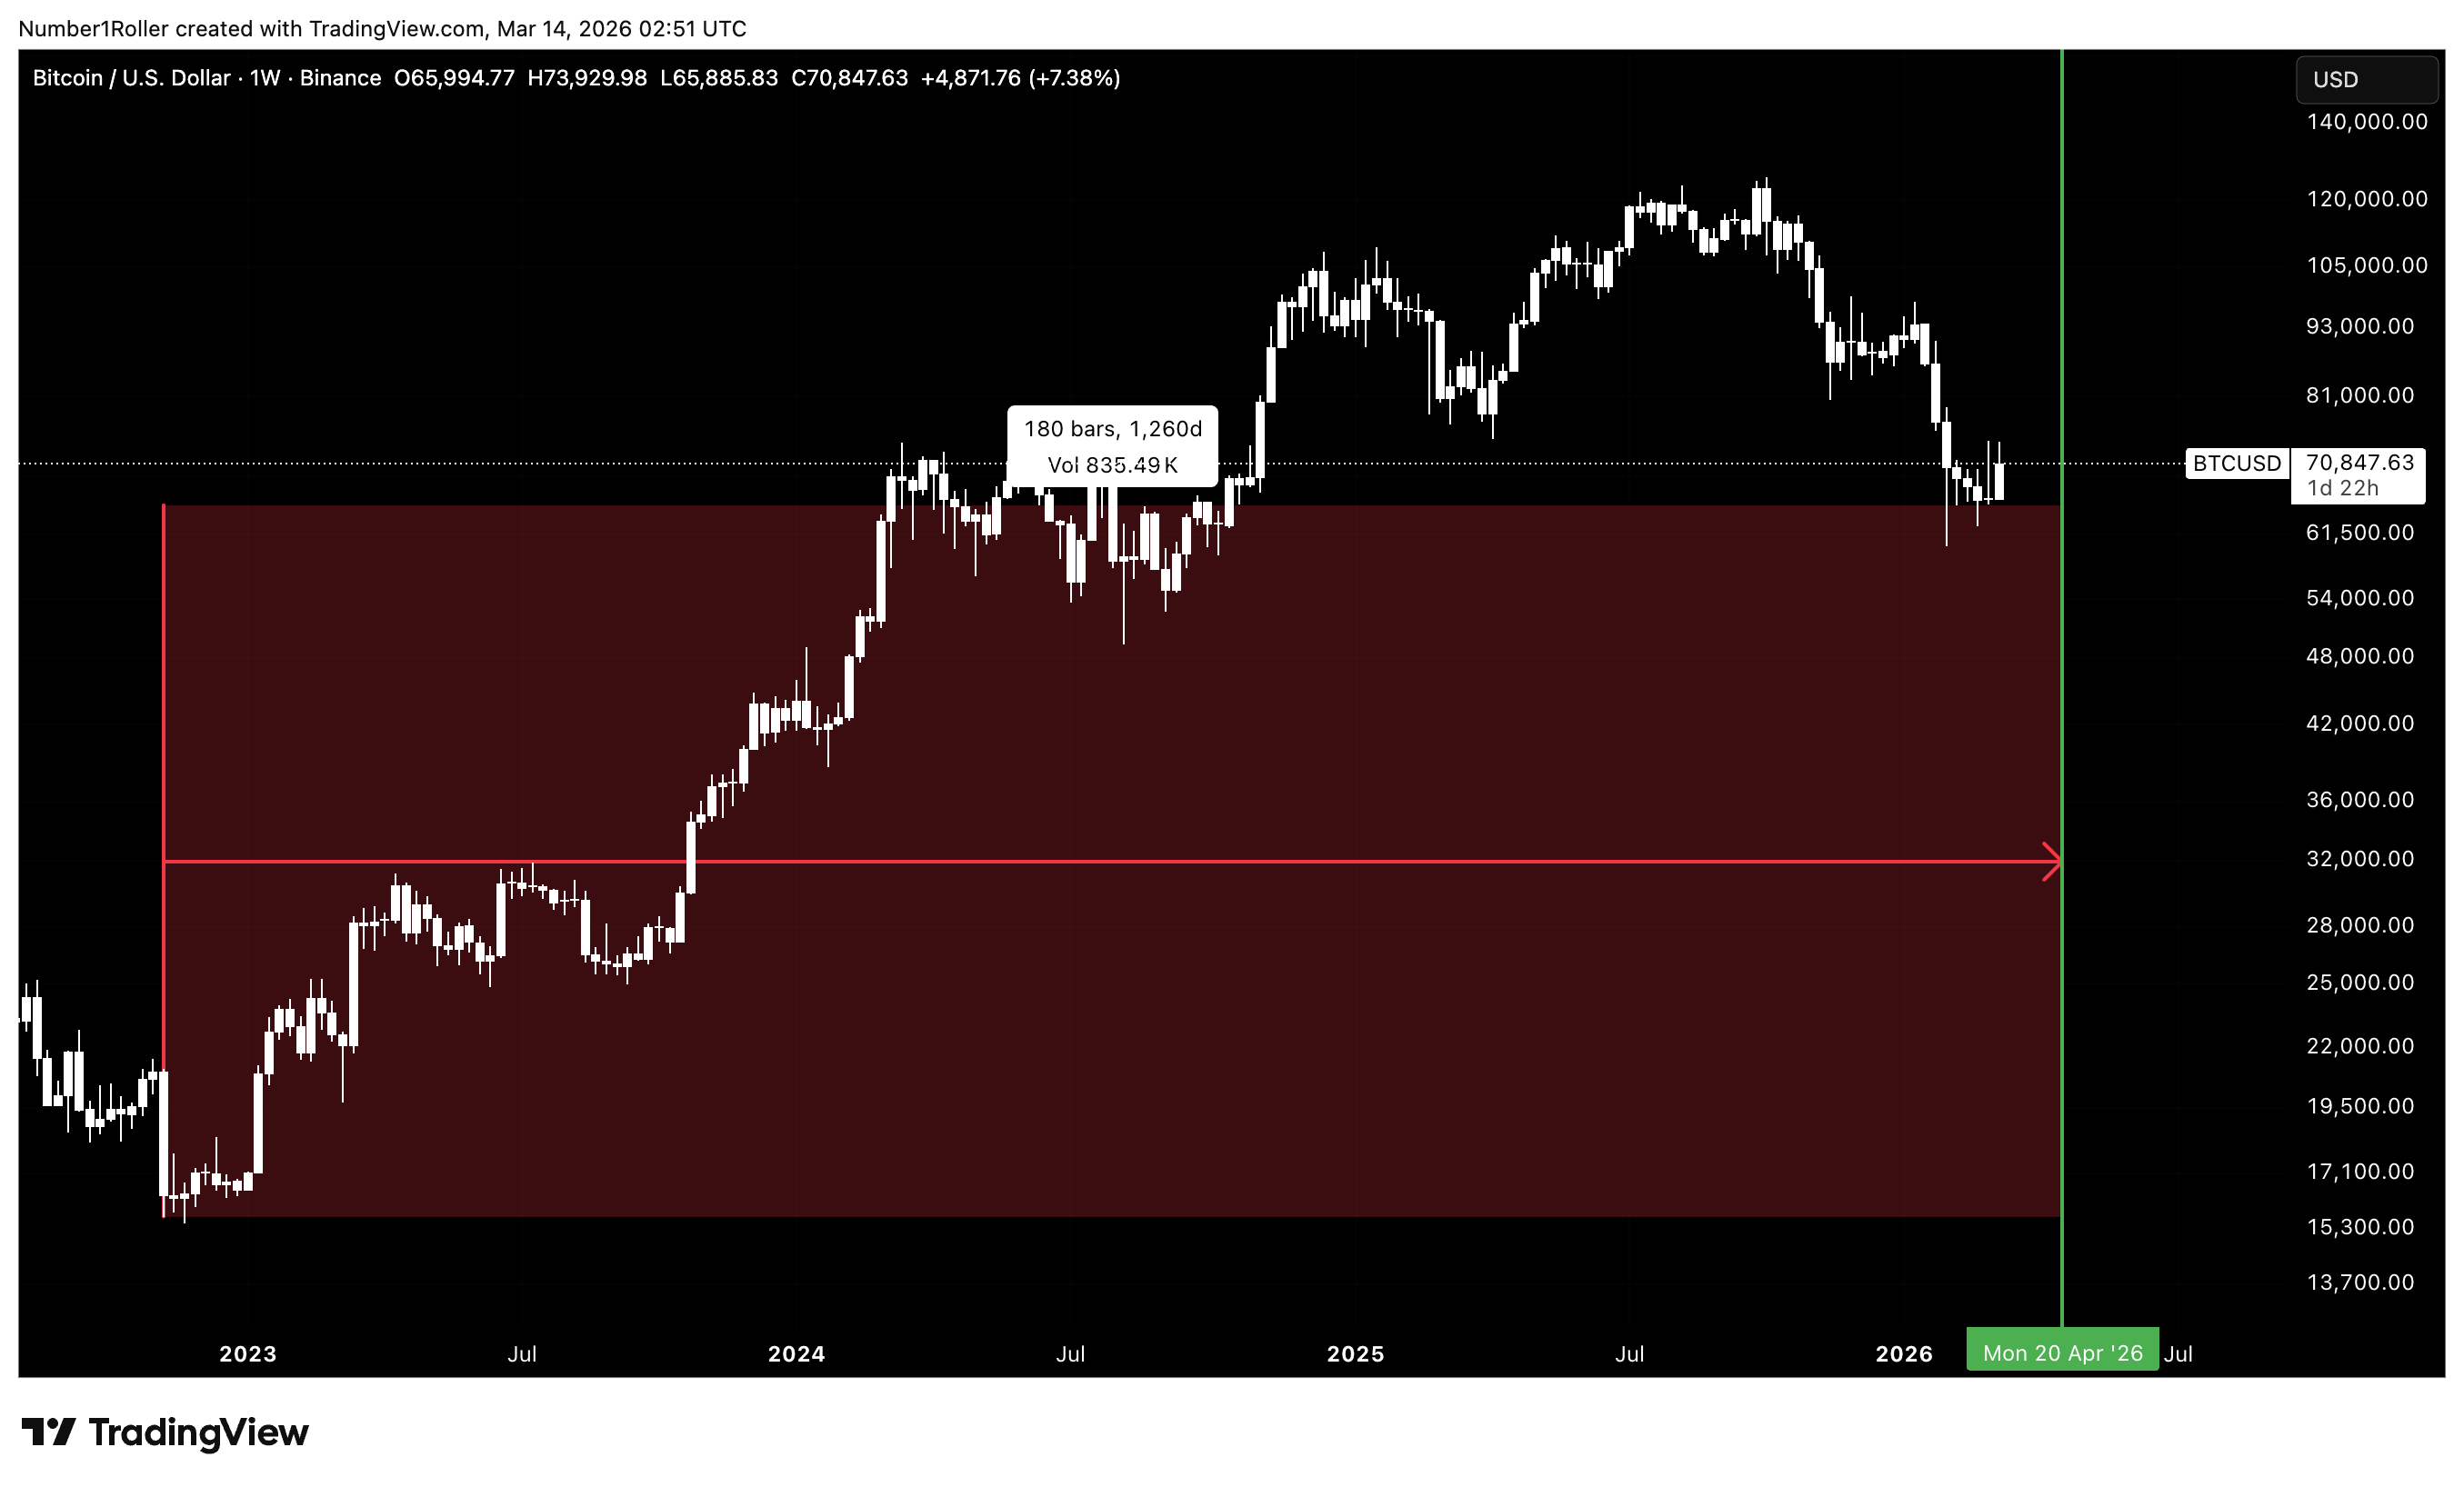
When we examine the major five-year cycles, each major top since 2013 has produced a major market bottom 60 months later.
If we measure from the first major top in 2021, we arrive directly at April of this year as the first major candidate for a serious bottom.
Gann’s Campaign Rule Is Now in Play
We also have one of Gann’s most important rules working in the background here.
He wrote:
“Bull or bear campaigns do not run more than 3 to 3½ years without a move of 3 to 6 months or one year in the opposite direction.”
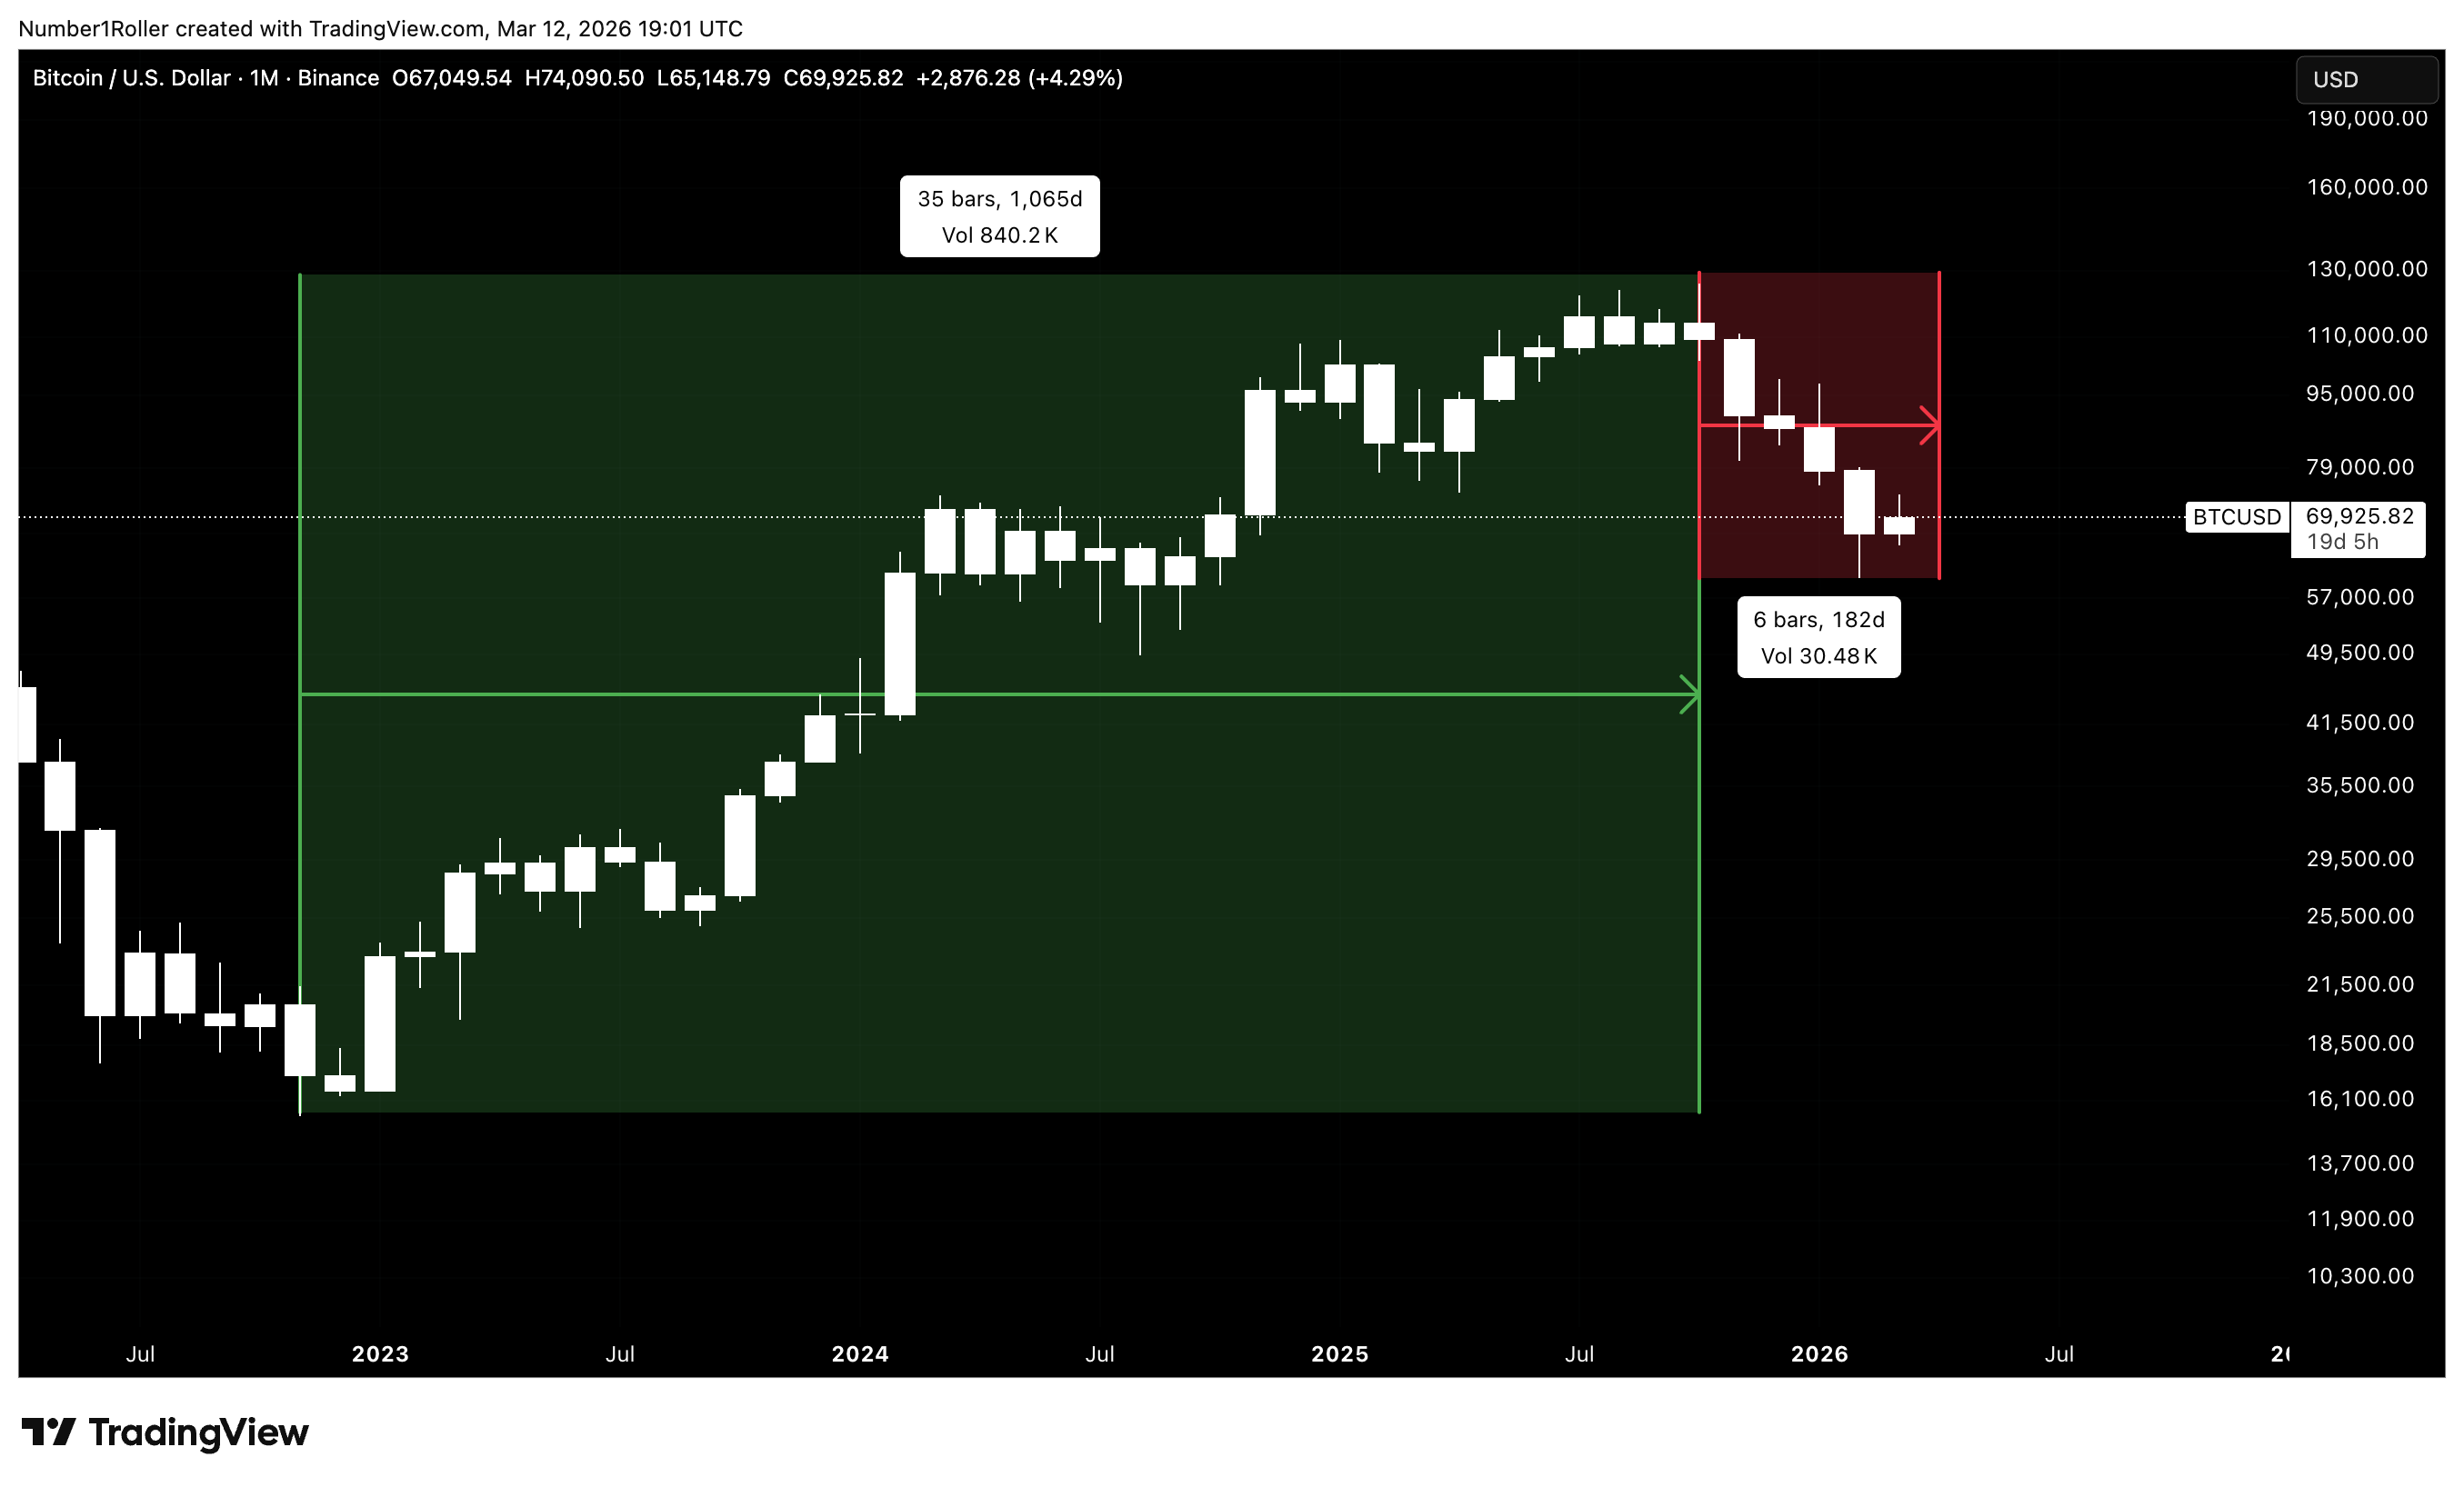
Bitcoin rallied for 35 months, just one month short of the full three years.
Since then, the market has declined for six consecutive months, which brings us to April as the seventh month — a number Gann often referred to as the fatal number in cycle structures.
The Historical Pattern Behind This Window
When we step back and examine the broader historical cycles, the pattern becomes even more interesting.
In 2021, a major countertrend rally began in April and ran strongly into June after six consecutive green months.
In 2016, we also saw a powerful three-month cyclical move from April into June.
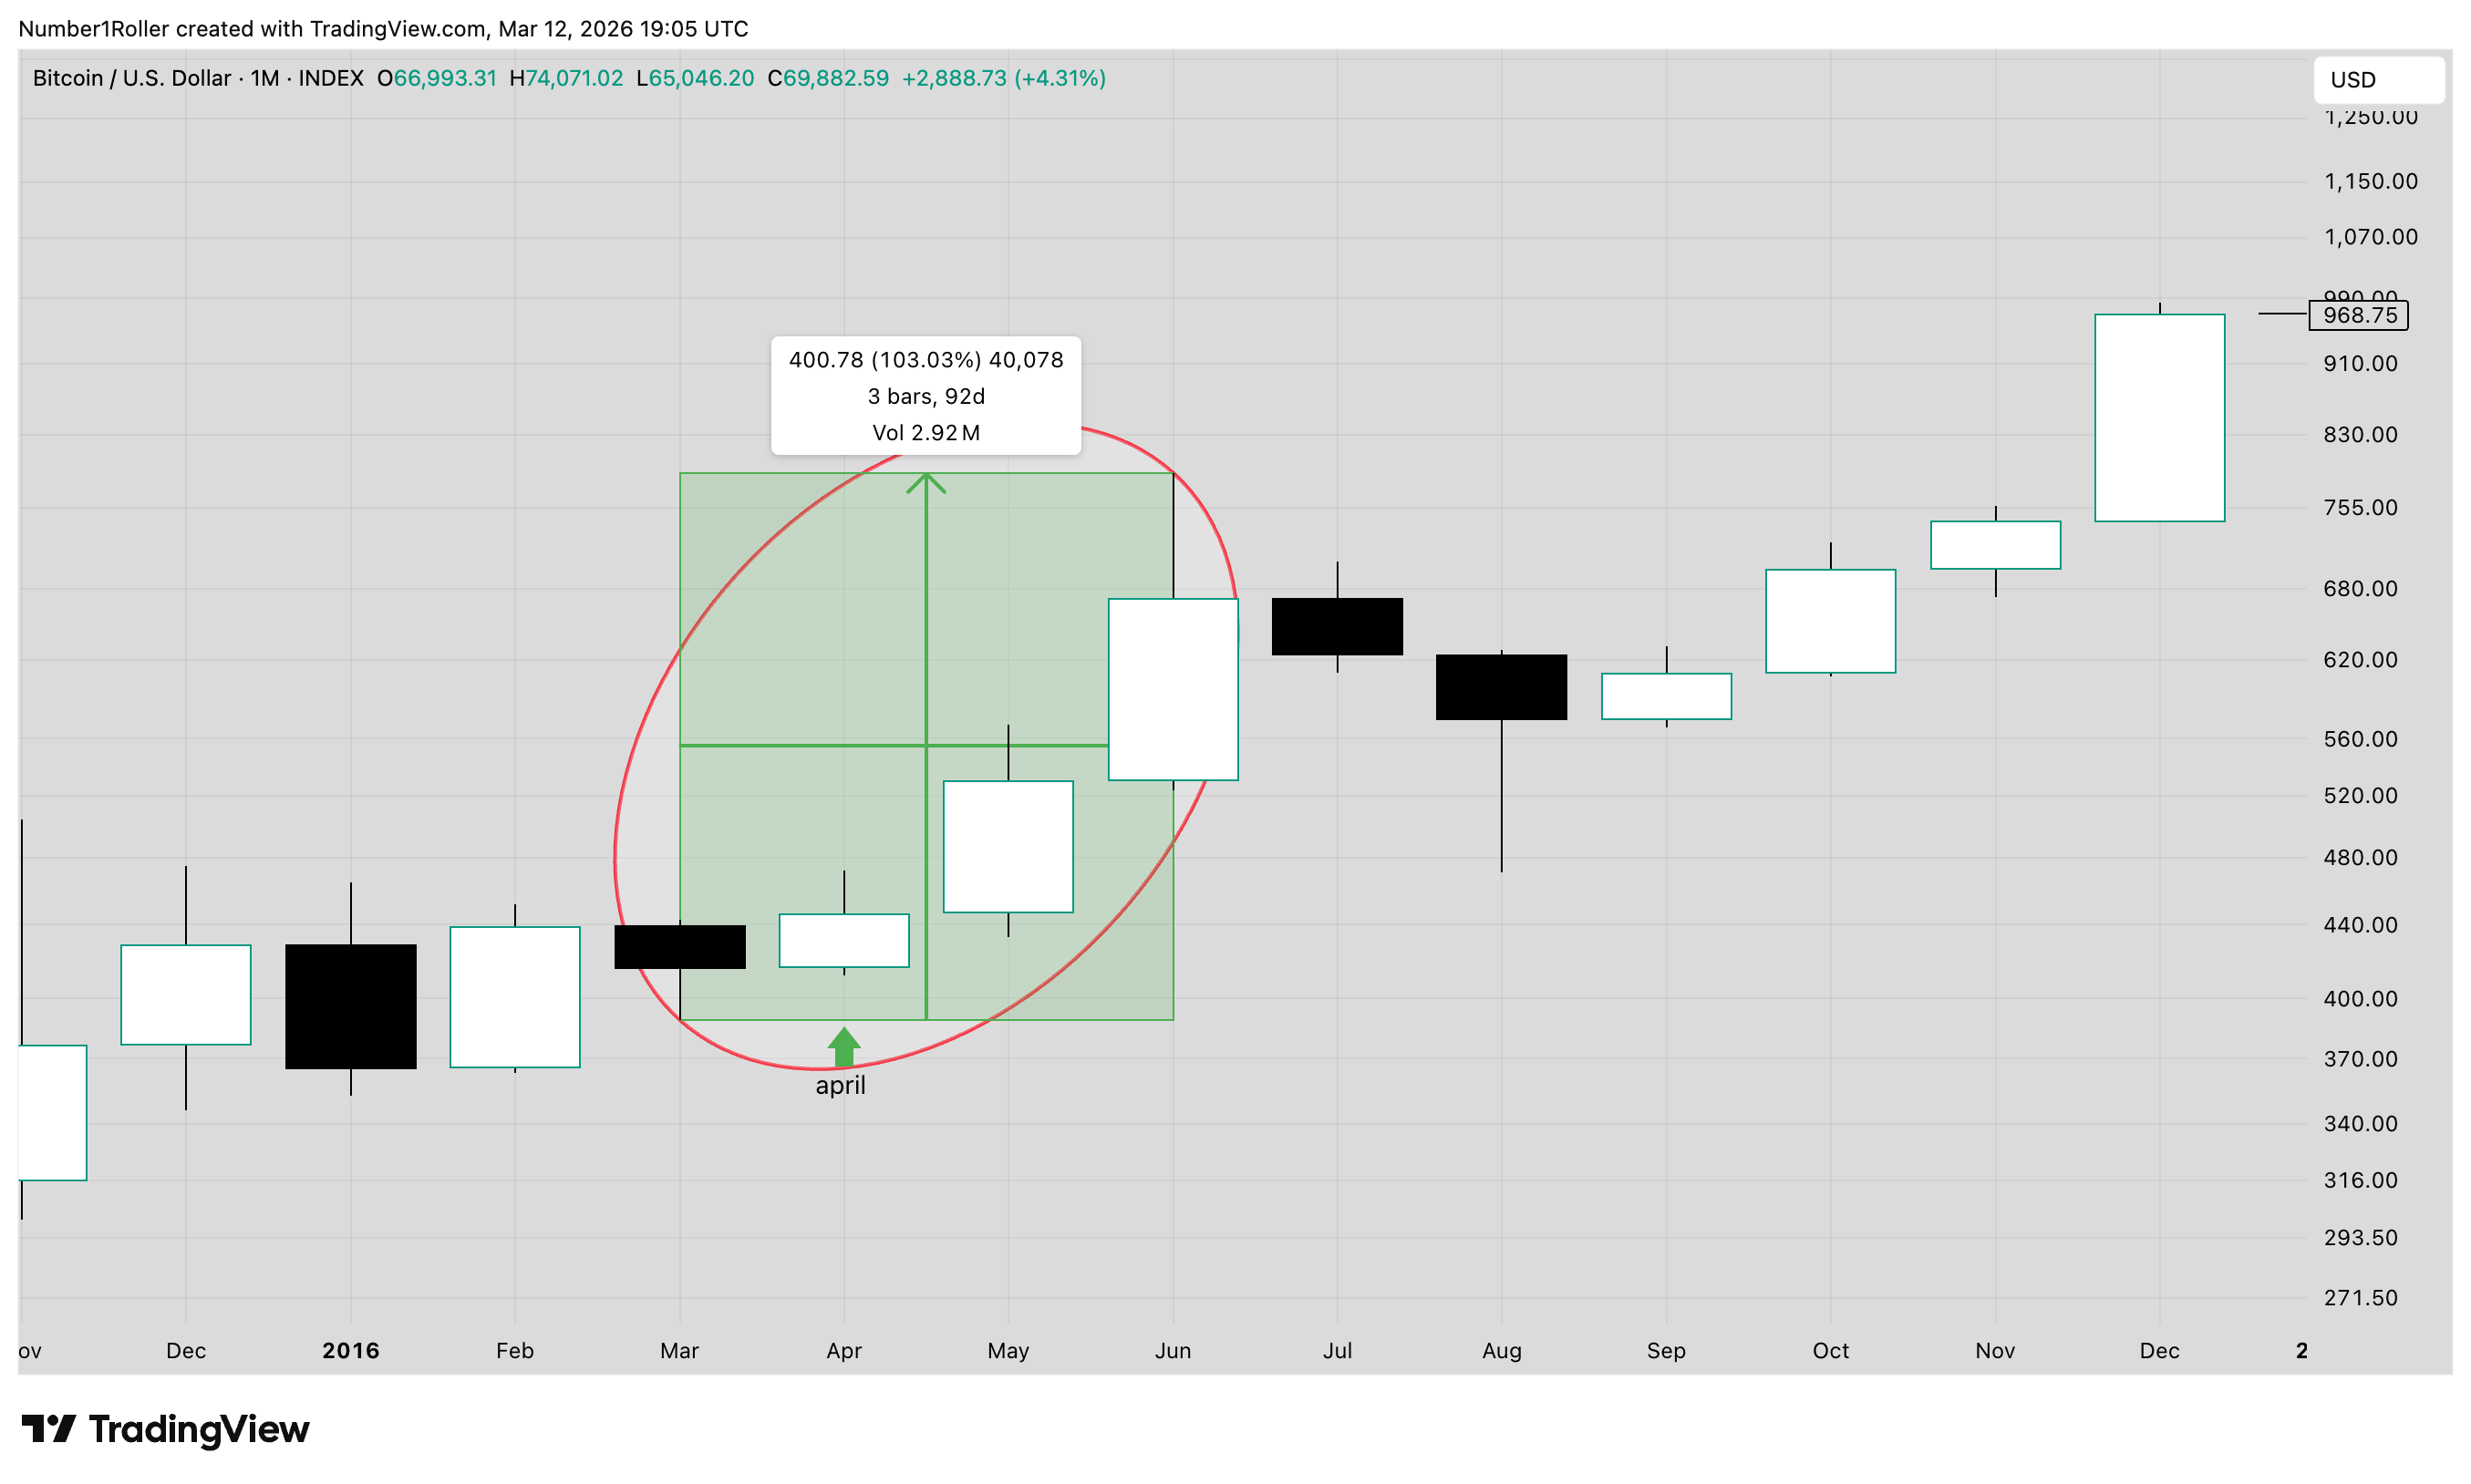
And again in 2011, a major low formed in April before launching a strong rally through early summer
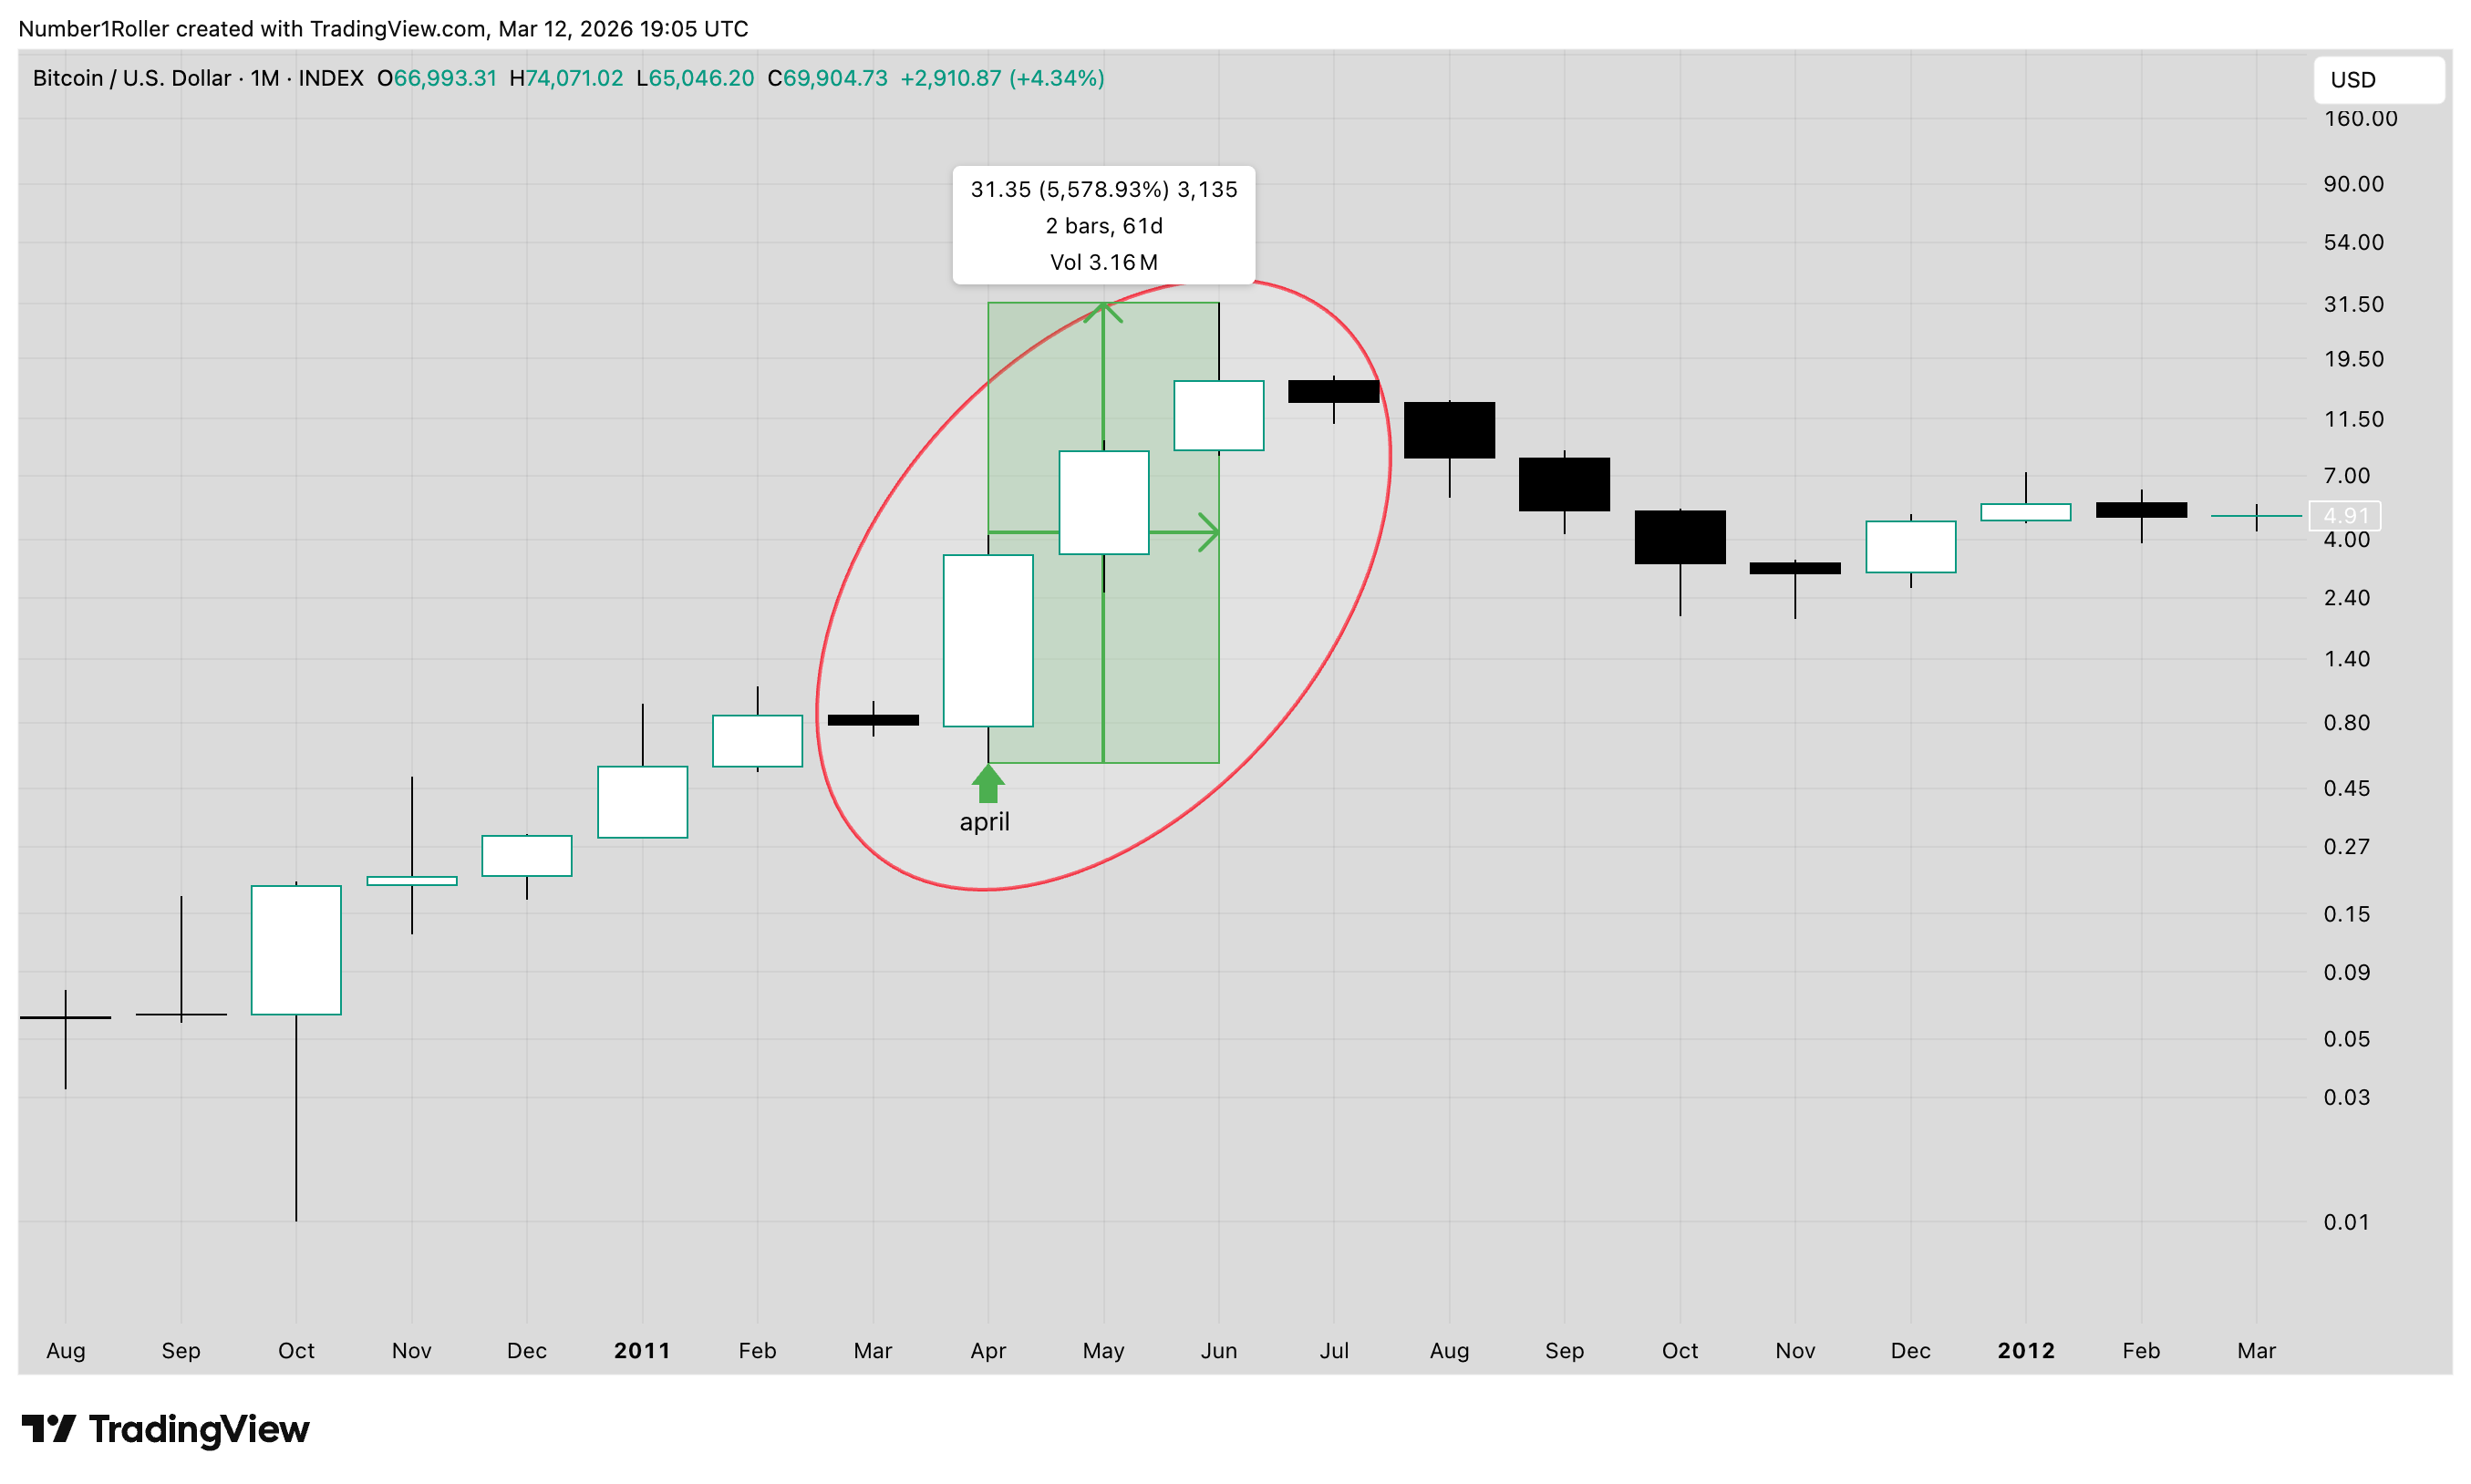
So what do we see?
One cycle shows a massive countertrend rally after six months of strength — which mirrors the inverse of our current setup — while the other two cycles show a very strong bullish period beginning in April.
Taken together, the cyclical probabilities point toward the same conclusion which is a countertrend rally/bullish period.
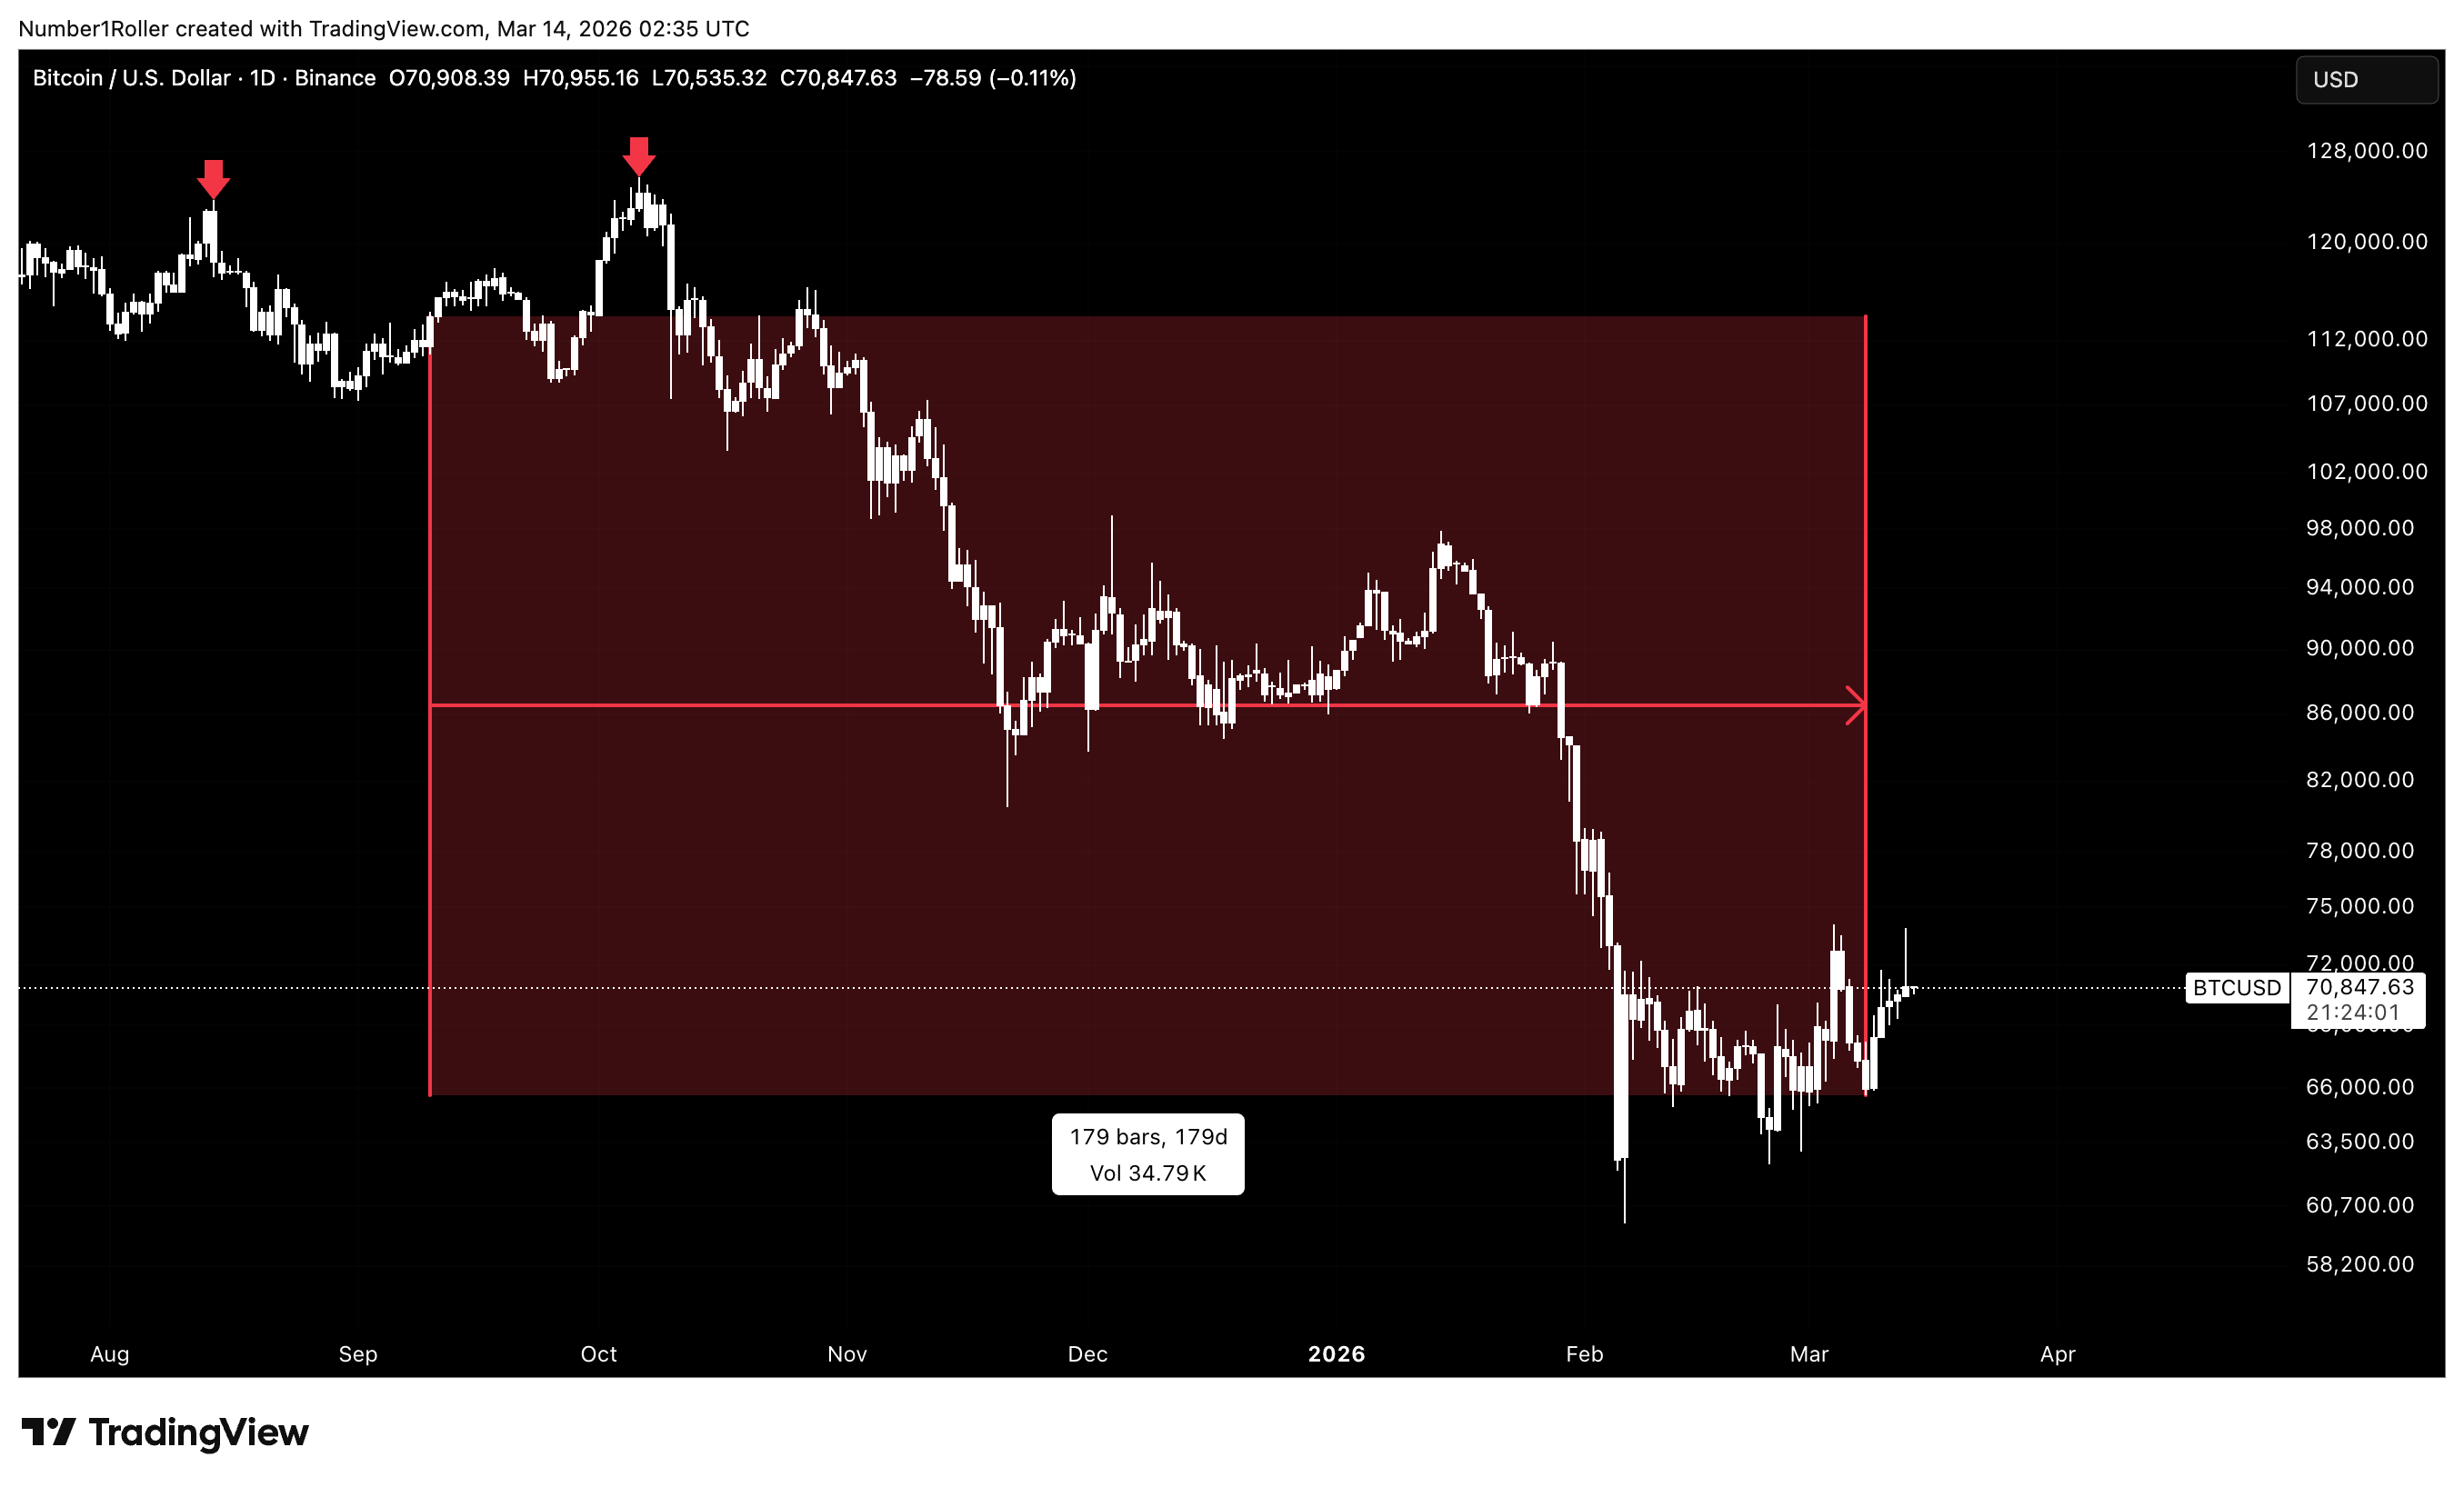
The Powerful 180-Degree Time Factor
Finally, all of this will coincide with one of the most powerful timing tools Gann ever discovered: the 180-degree time factor.
This concept has been instrumental in our work.
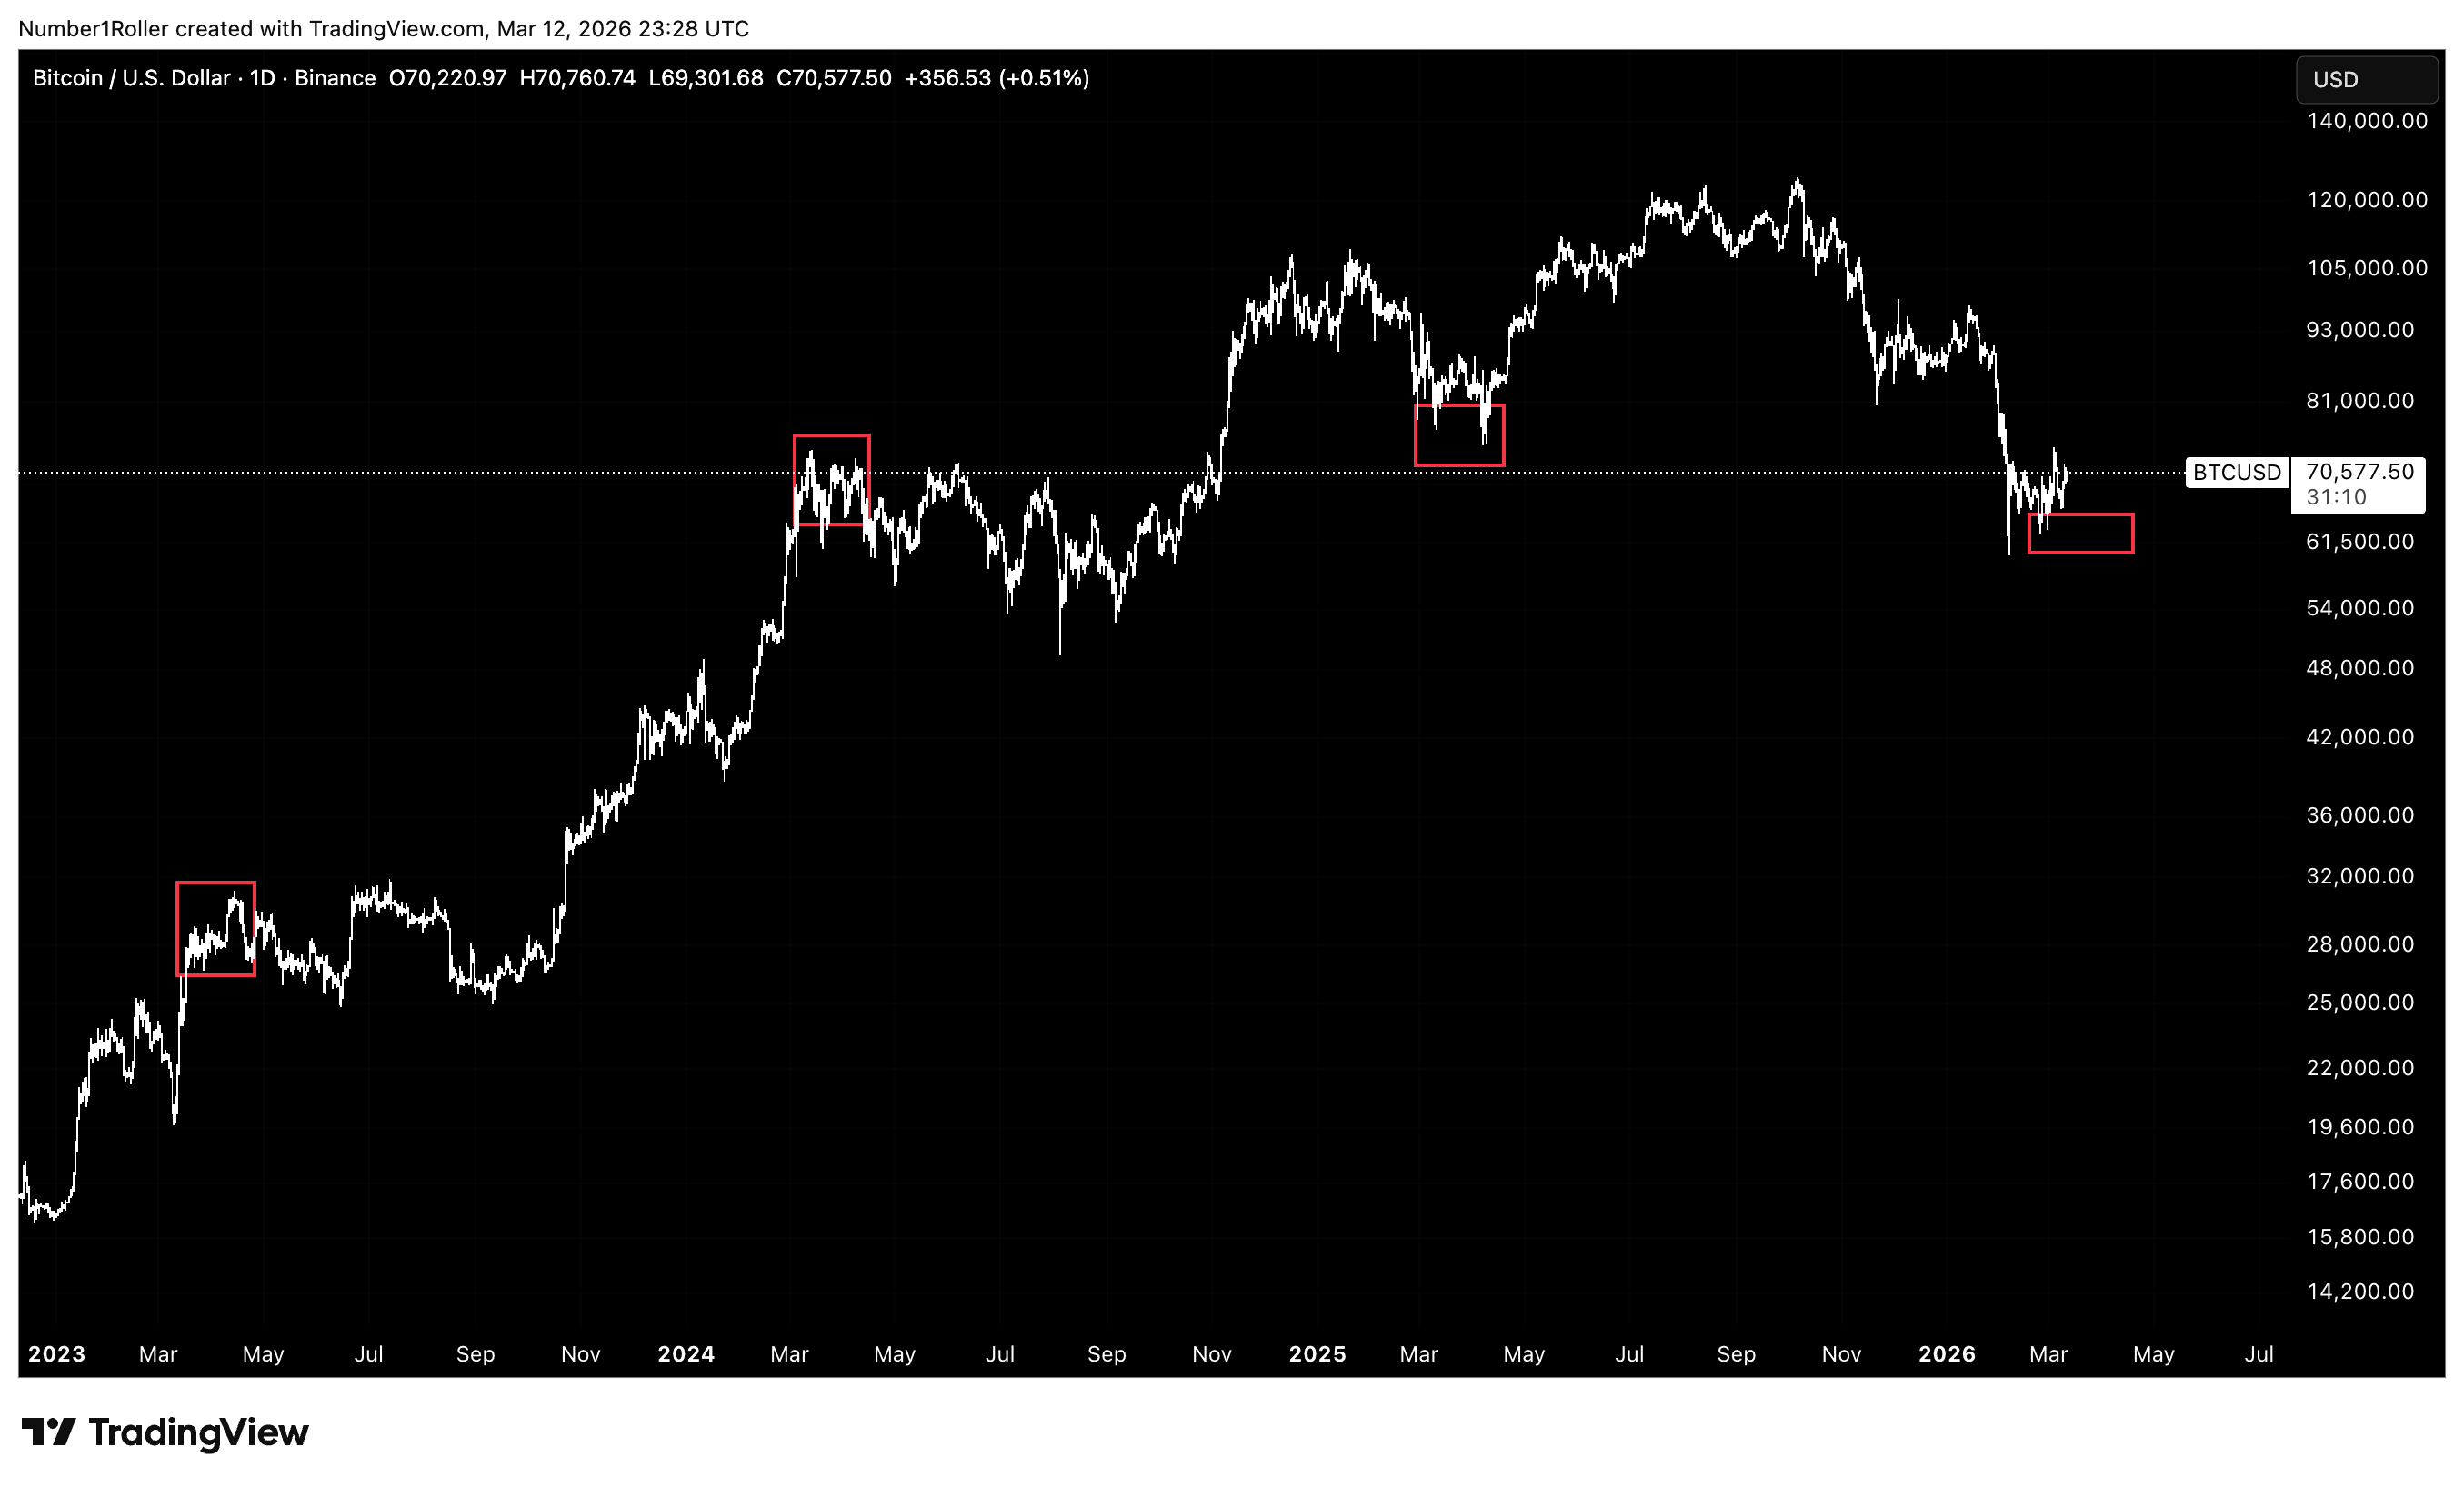
Notice how the last several pressure dates marked a reversal lower. A major signal of a trend change would occur if this late March / early April time factor produces a reversal higher off a low, rather than another move lower.
There’s also an important rule regarding double tops.
When measuring time from a double top, the correct approach is to measure from the midpoint between the two tops.
Using that method, the 180-day window has already appeared — and it did in fact produce a low and reversal in March.
How This Pattern Has Repeated
To understand how powerful this time factor has been, we can look back at recent examples.
In 2024, measuring 180 days from the midpoint of the March–April double top produced a higher low.
In 2023, performing the same calculation produced another important higher low.
Even during the 2021 bear market, the 180-degree date marked a major swing low and reversal.
In other words, these dates consistently matter.
The Pattern Within This Cycle
Another interesting observation is that these 180-degree cycles tend to balance out within the year.
In our current cycle, they appear repeatedly around September–October and again around March–April, which is obvious considering they are roughly six months apart.
When we expand the analysis further:
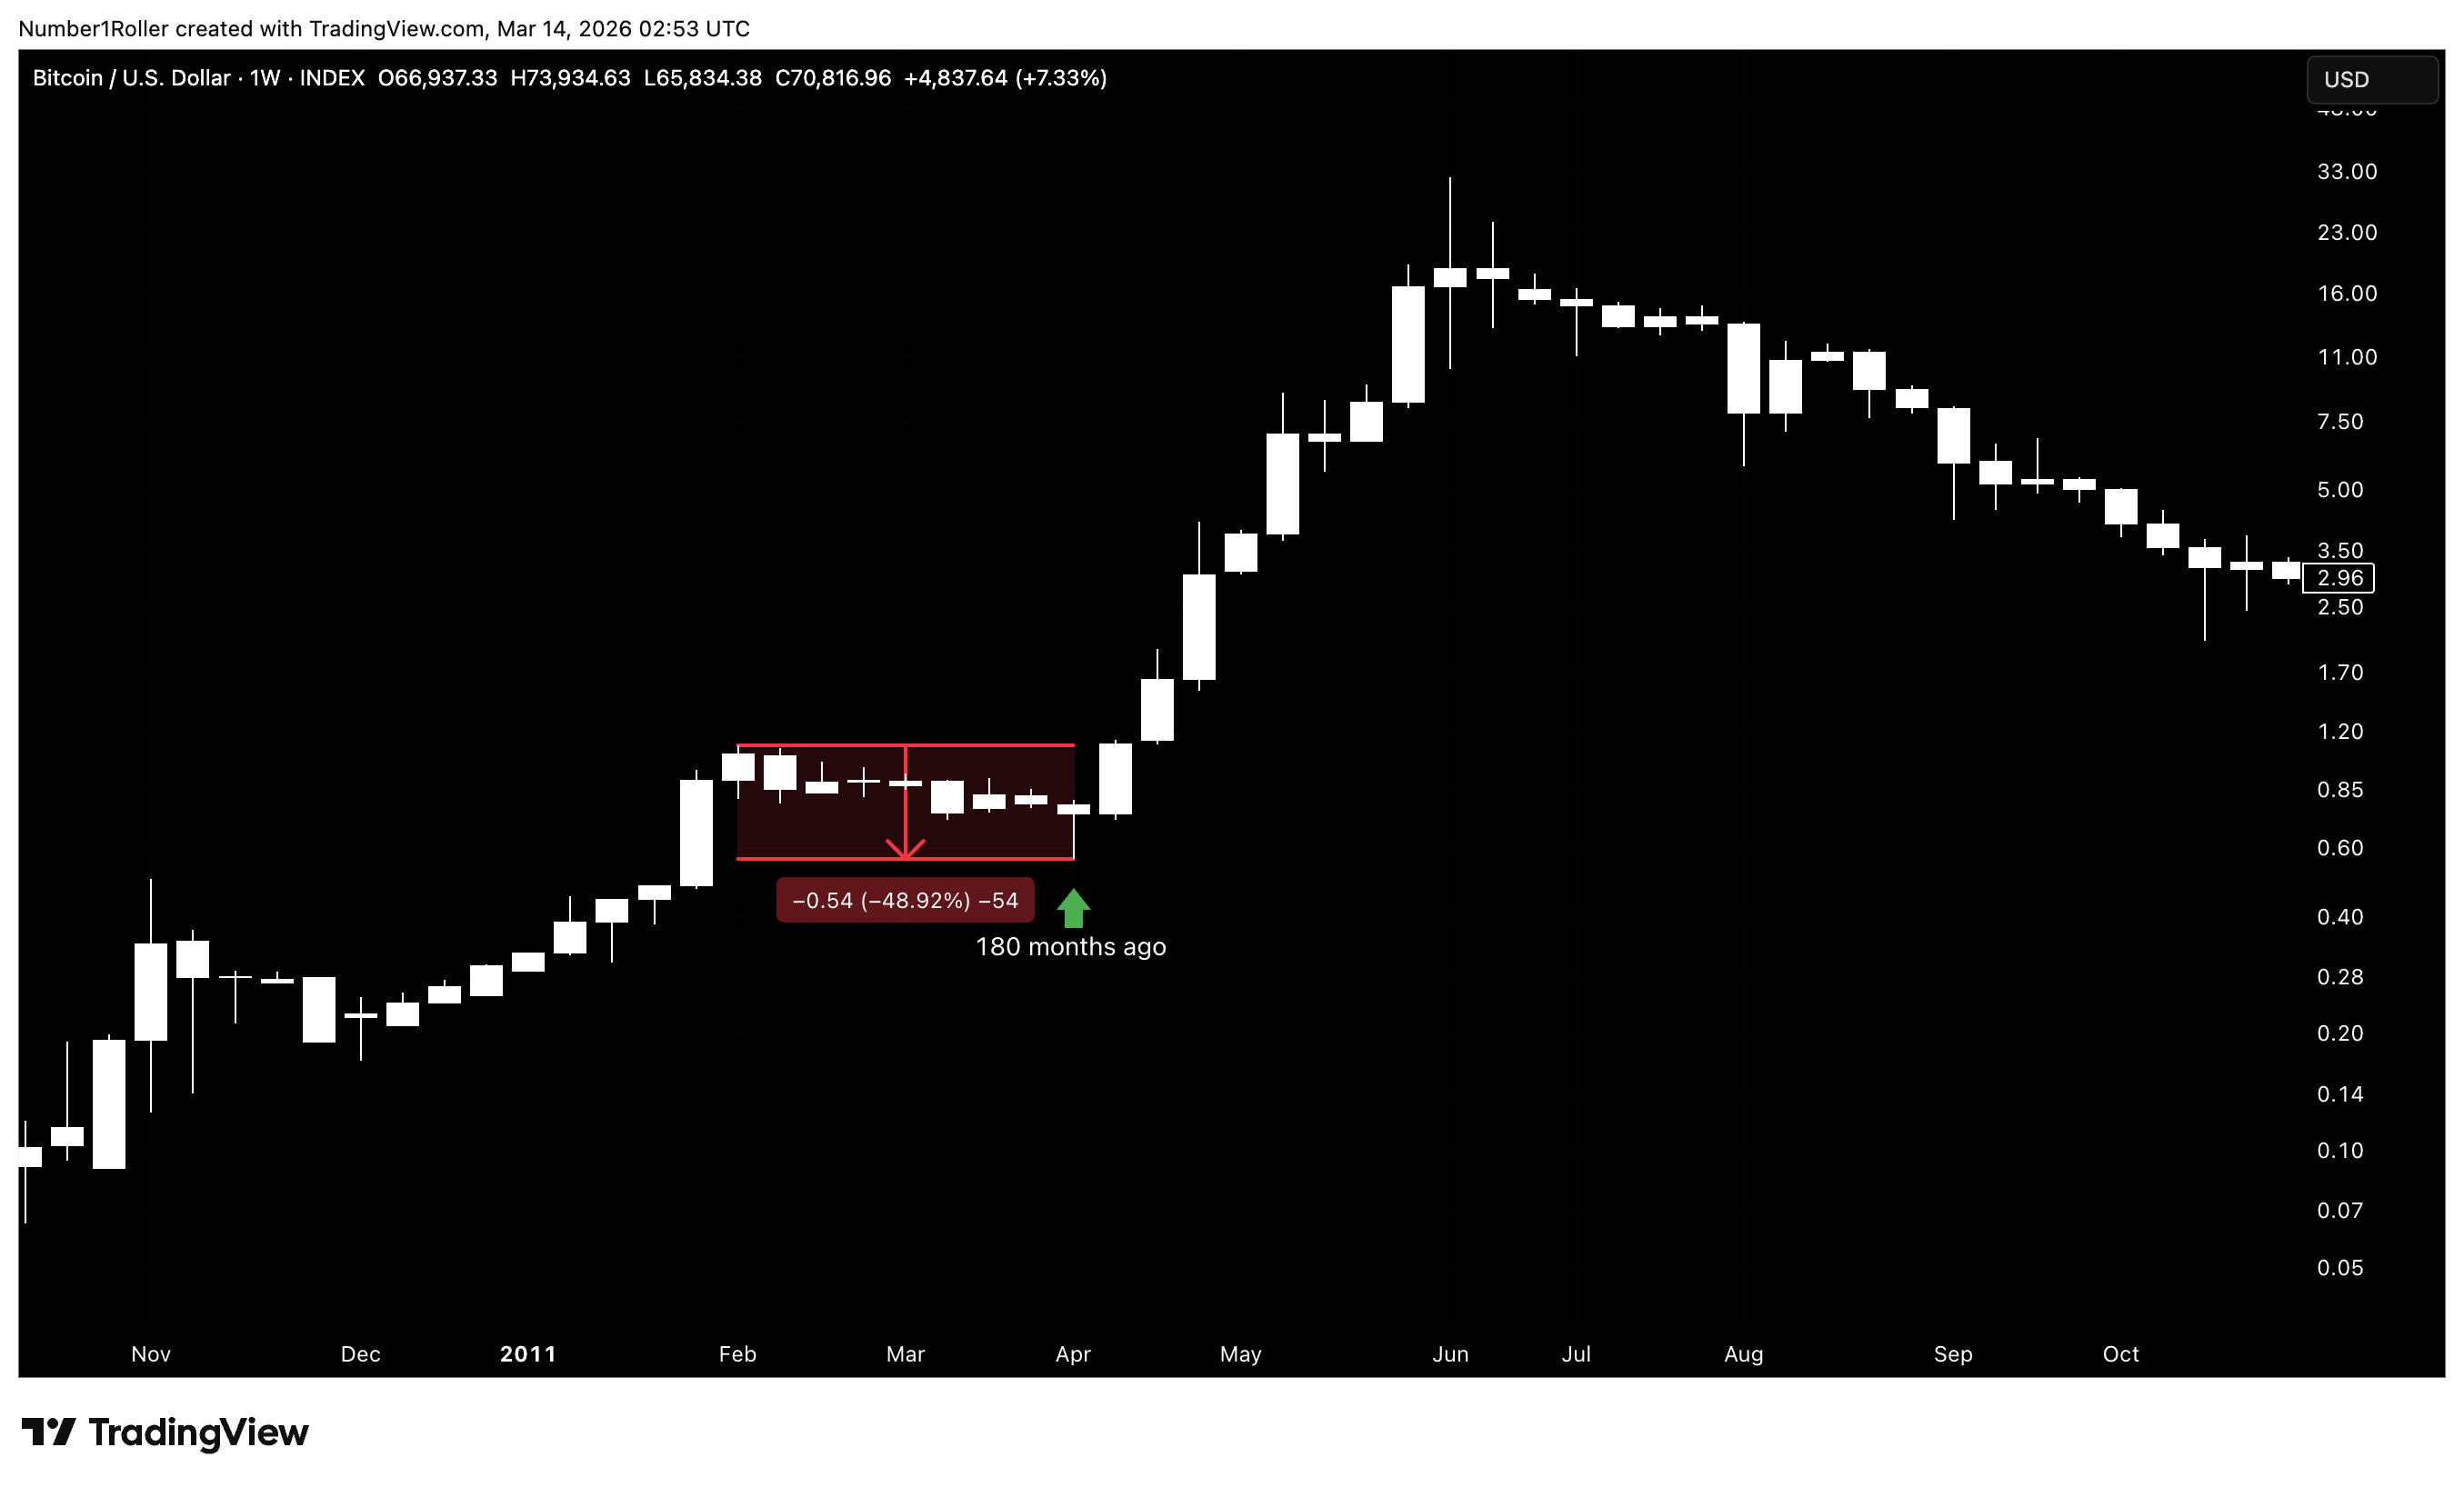
180 weeks ago from April would mark the 2022 bear market bottom
180 months ago would land in April 2011, which also produced a major market low
The pattern continues to repeat across multiple timeframes.
And if we look at the behavior of the market since 2023, each March–April window has produced a double move and reversal.
So the question becomes:
What are the odds we see one more low inside this window that forms a major bottom?
In my view, they are very high.
The Coming Inflection Point
When we step back and look at the entire picture — the squaring of time and price, the long-term cycles, the historical patterns, and the powerful 180-degree relationships — it becomes very difficult to ignore what the market is telling us.
April stands out as one of the strongest candidates for a major reversal that we have seen in quite some time.
Since the November low failed to hold, we have not seen a time factor with enough evidence to confidently suggest a major turning point. But this window is different. The amount of cyclical pressure building into late March and early April is unlike anything we’ve seen over the past six months.
At the same time, the market has endured six months of relentless selling pressure with almost no relief. Sentiment is extremely negative, the macro backdrop is filled with fear, and most investors are preparing for the worst.
Time and again the market has shown that when these time relationships begin to converge, something important is about to happen.
That doesn’t mean the path will be easy. We could very well see one final wave of panic, perhaps driven by negative headlines or another sharp shakeout.
But if the structure continues to unfold the way it appears to be setting up, that move would likely mark the final low of this decline, followed by a powerful reversal.
In other words, the pressure that has been building for months is about to resolve.
And if the analysis is correct, the next move will catch a lot of people off guard.